
Reports
Reports turns board history into delivery signals for operating reviews.
Date range and export
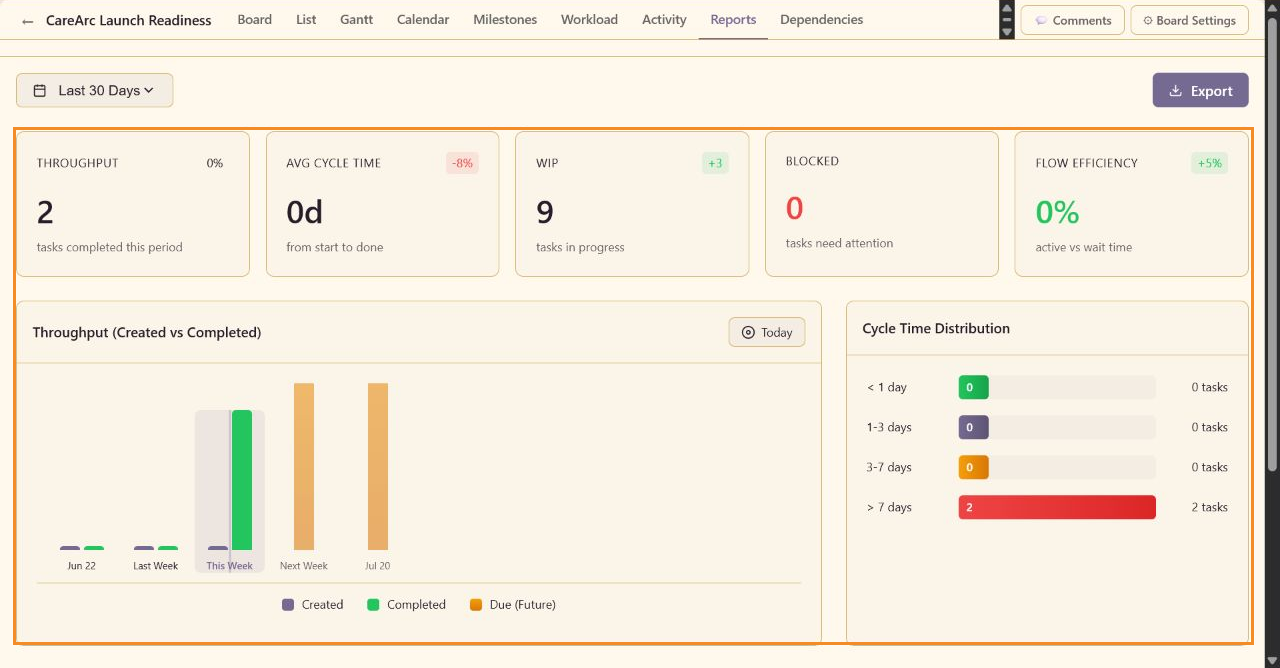
Section titled “Date range and export”Choose Last 7 Days, Last 14 Days, Last 30 Days, or Last 90 Days. Export downloads the report data for the selected range.
Headline metrics
Section titled “Headline metrics”- Throughput counts completed tasks.
- Avg Cycle Time measures start to completion.
- WIP counts work in progress.
- Blocked counts tasks needing attention.
- Flow Efficiency compares active time with waiting time.
Charts and distributions
Section titled “Charts and distributions”The report includes Created versus Completed throughput, future due work, Cycle Time Distribution, Blocked Tasks, Task Aging for in-progress work, and Sprint Velocity.
Check the underlying data before you trust a zero value: start dates, completion dates, status changes, assignments, and time history determine which metrics can be calculated.