
Data Hub quickstart
This takes a service from no data to a saved view that Dashboards can chart. It takes about fifteen minutes.
You need a database Data Hub can reach and, for the first step only, the platform admin role. If you do not have it, someone who does can create the connection and you can pick up from step 3.
1. Open the workspace
Section titled “1. Open the workspace”Open a service, choose Data Hub under Data, then choose Open Data Hub.
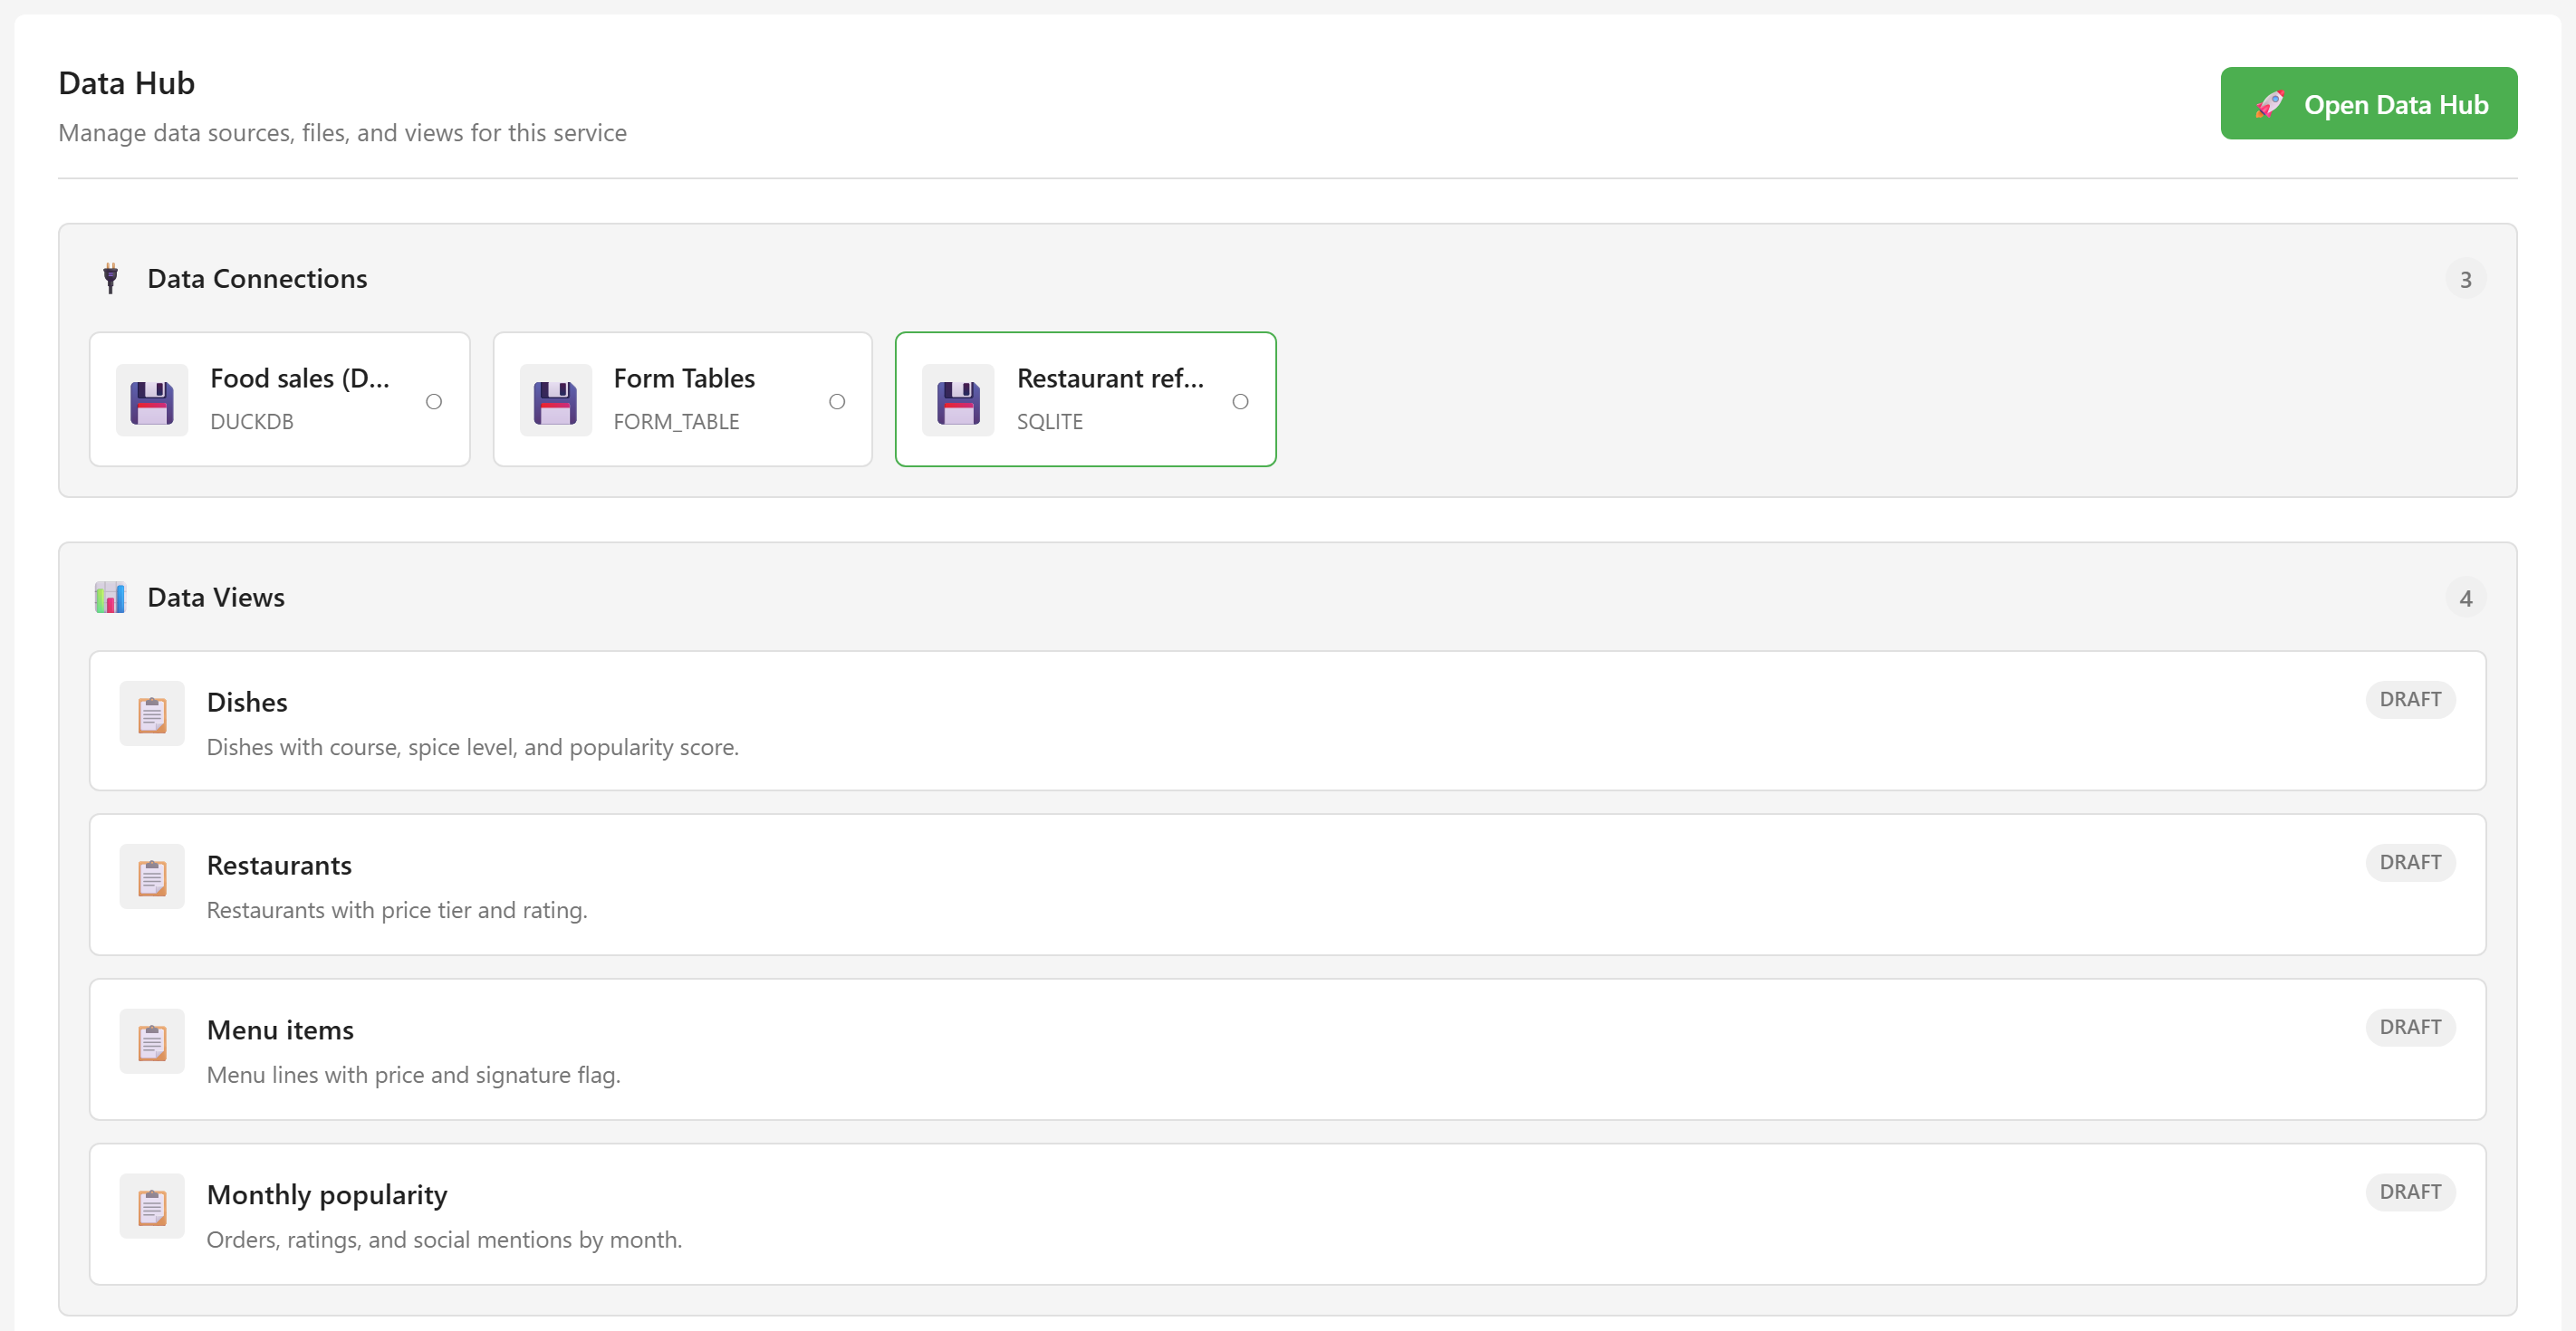
The module card is a summary. The workspace behind it is where you do everything.
2. Connect a database
Section titled “2. Connect a database”Choose + beside CONNECTIONS.
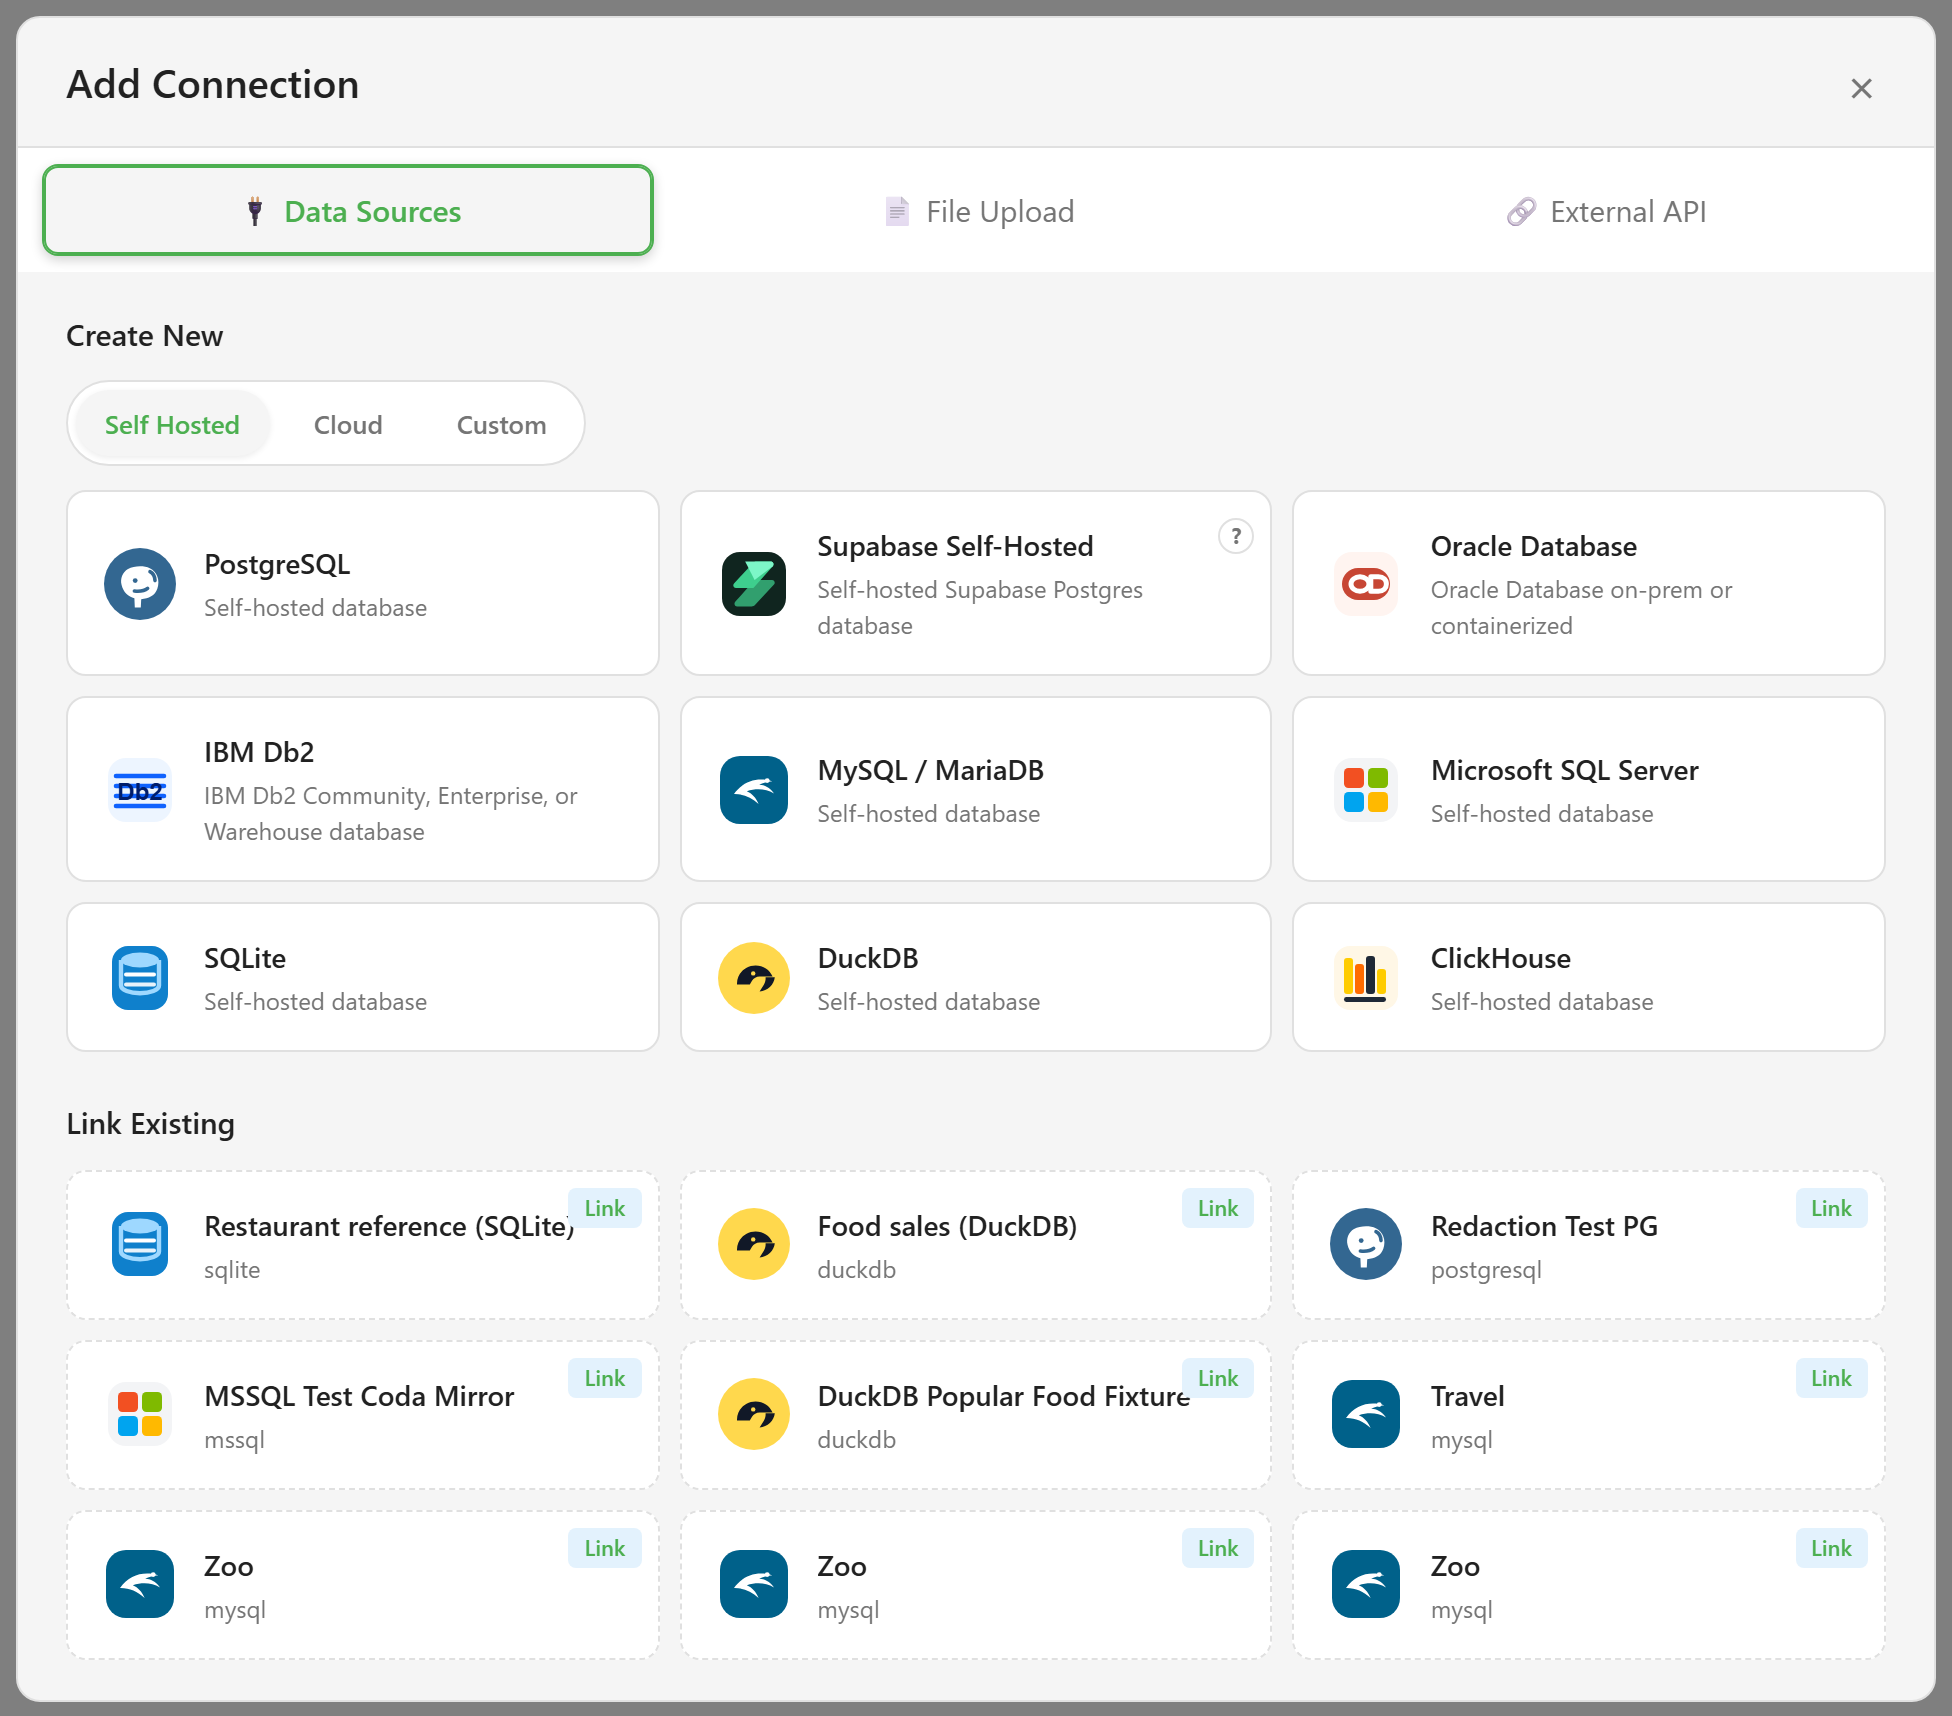
Pick your database from Self Hosted, Cloud, or Custom. If the source is already connected somewhere on the platform, scroll to Link Existing and link it instead of creating a duplicate.
The examples here use a SQLite file with a customers table and an orders table.
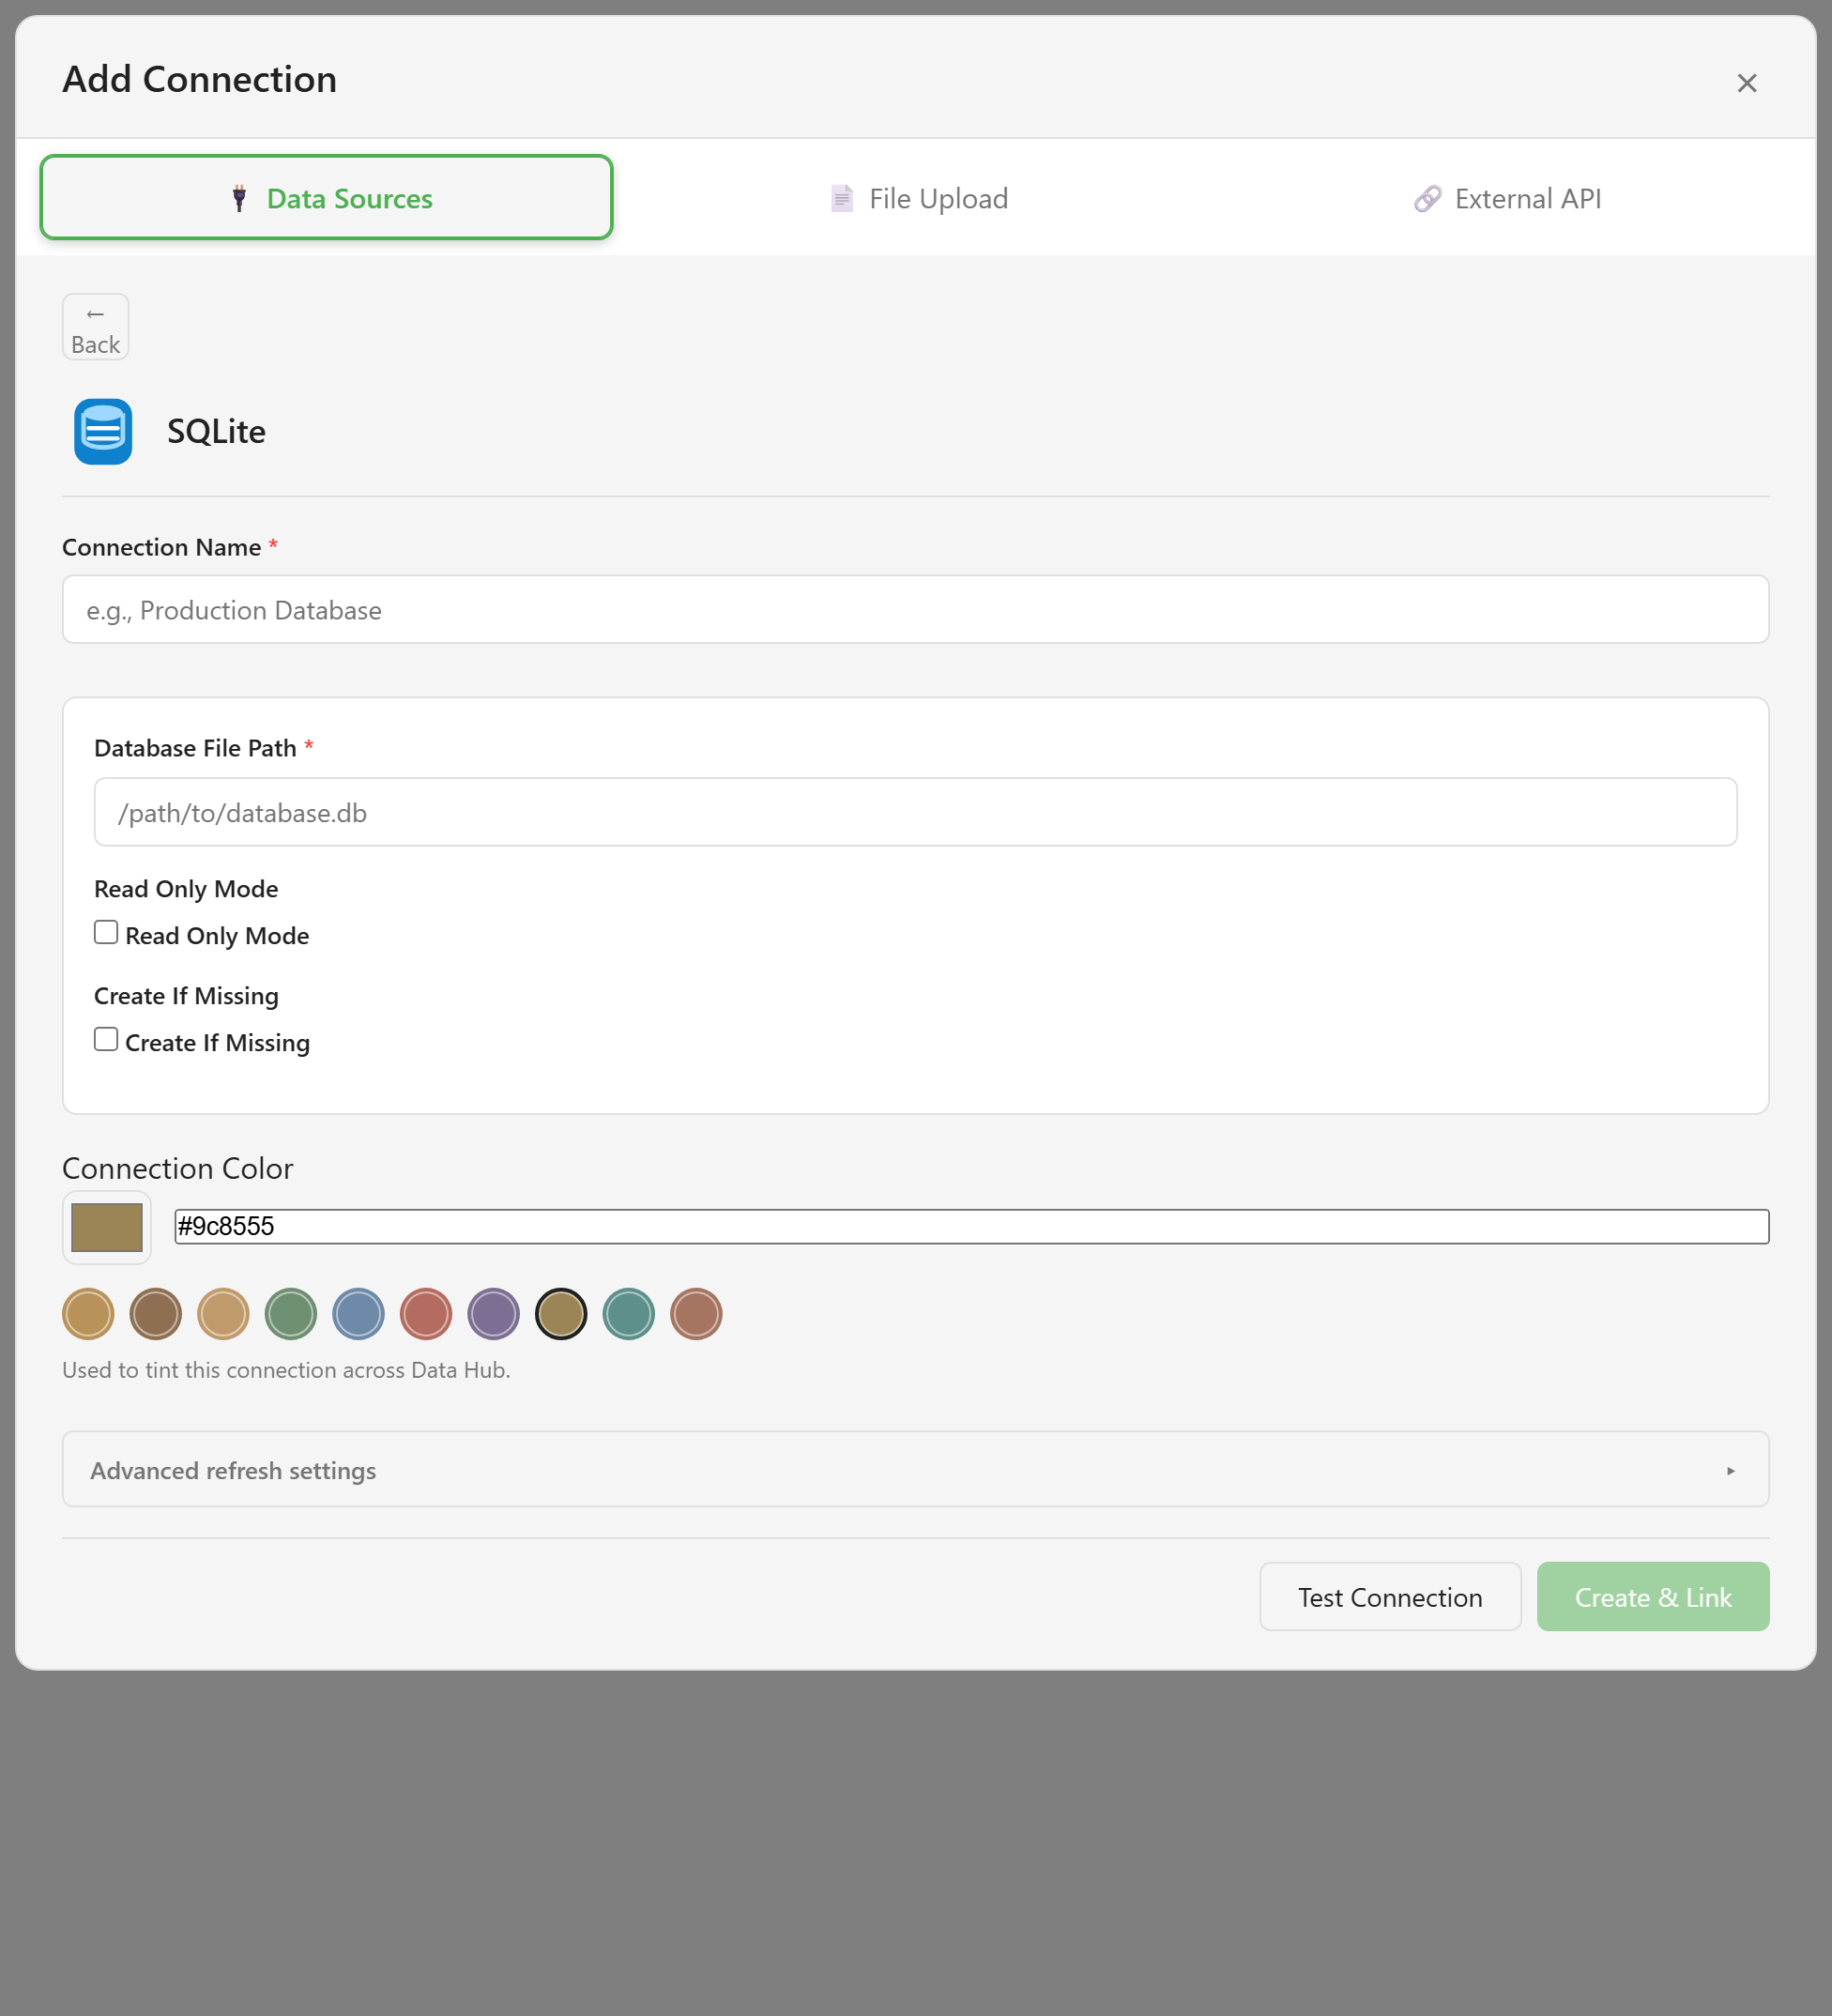
Fill in the name and the connection details. Connector catalogue lists what each connector needs.
Give it a Connection Color. It tints the connection everywhere it appears, which stops you querying staging when you meant production.
Choose Test Connection before saving. A green result means the credentials work.
Then choose Create & Link, which creates the source and links it to this service.
3. Enable the tables you want
Section titled “3. Enable the tables you want”The connection appears in the sidebar. Select it and you will see its tables — all hidden.
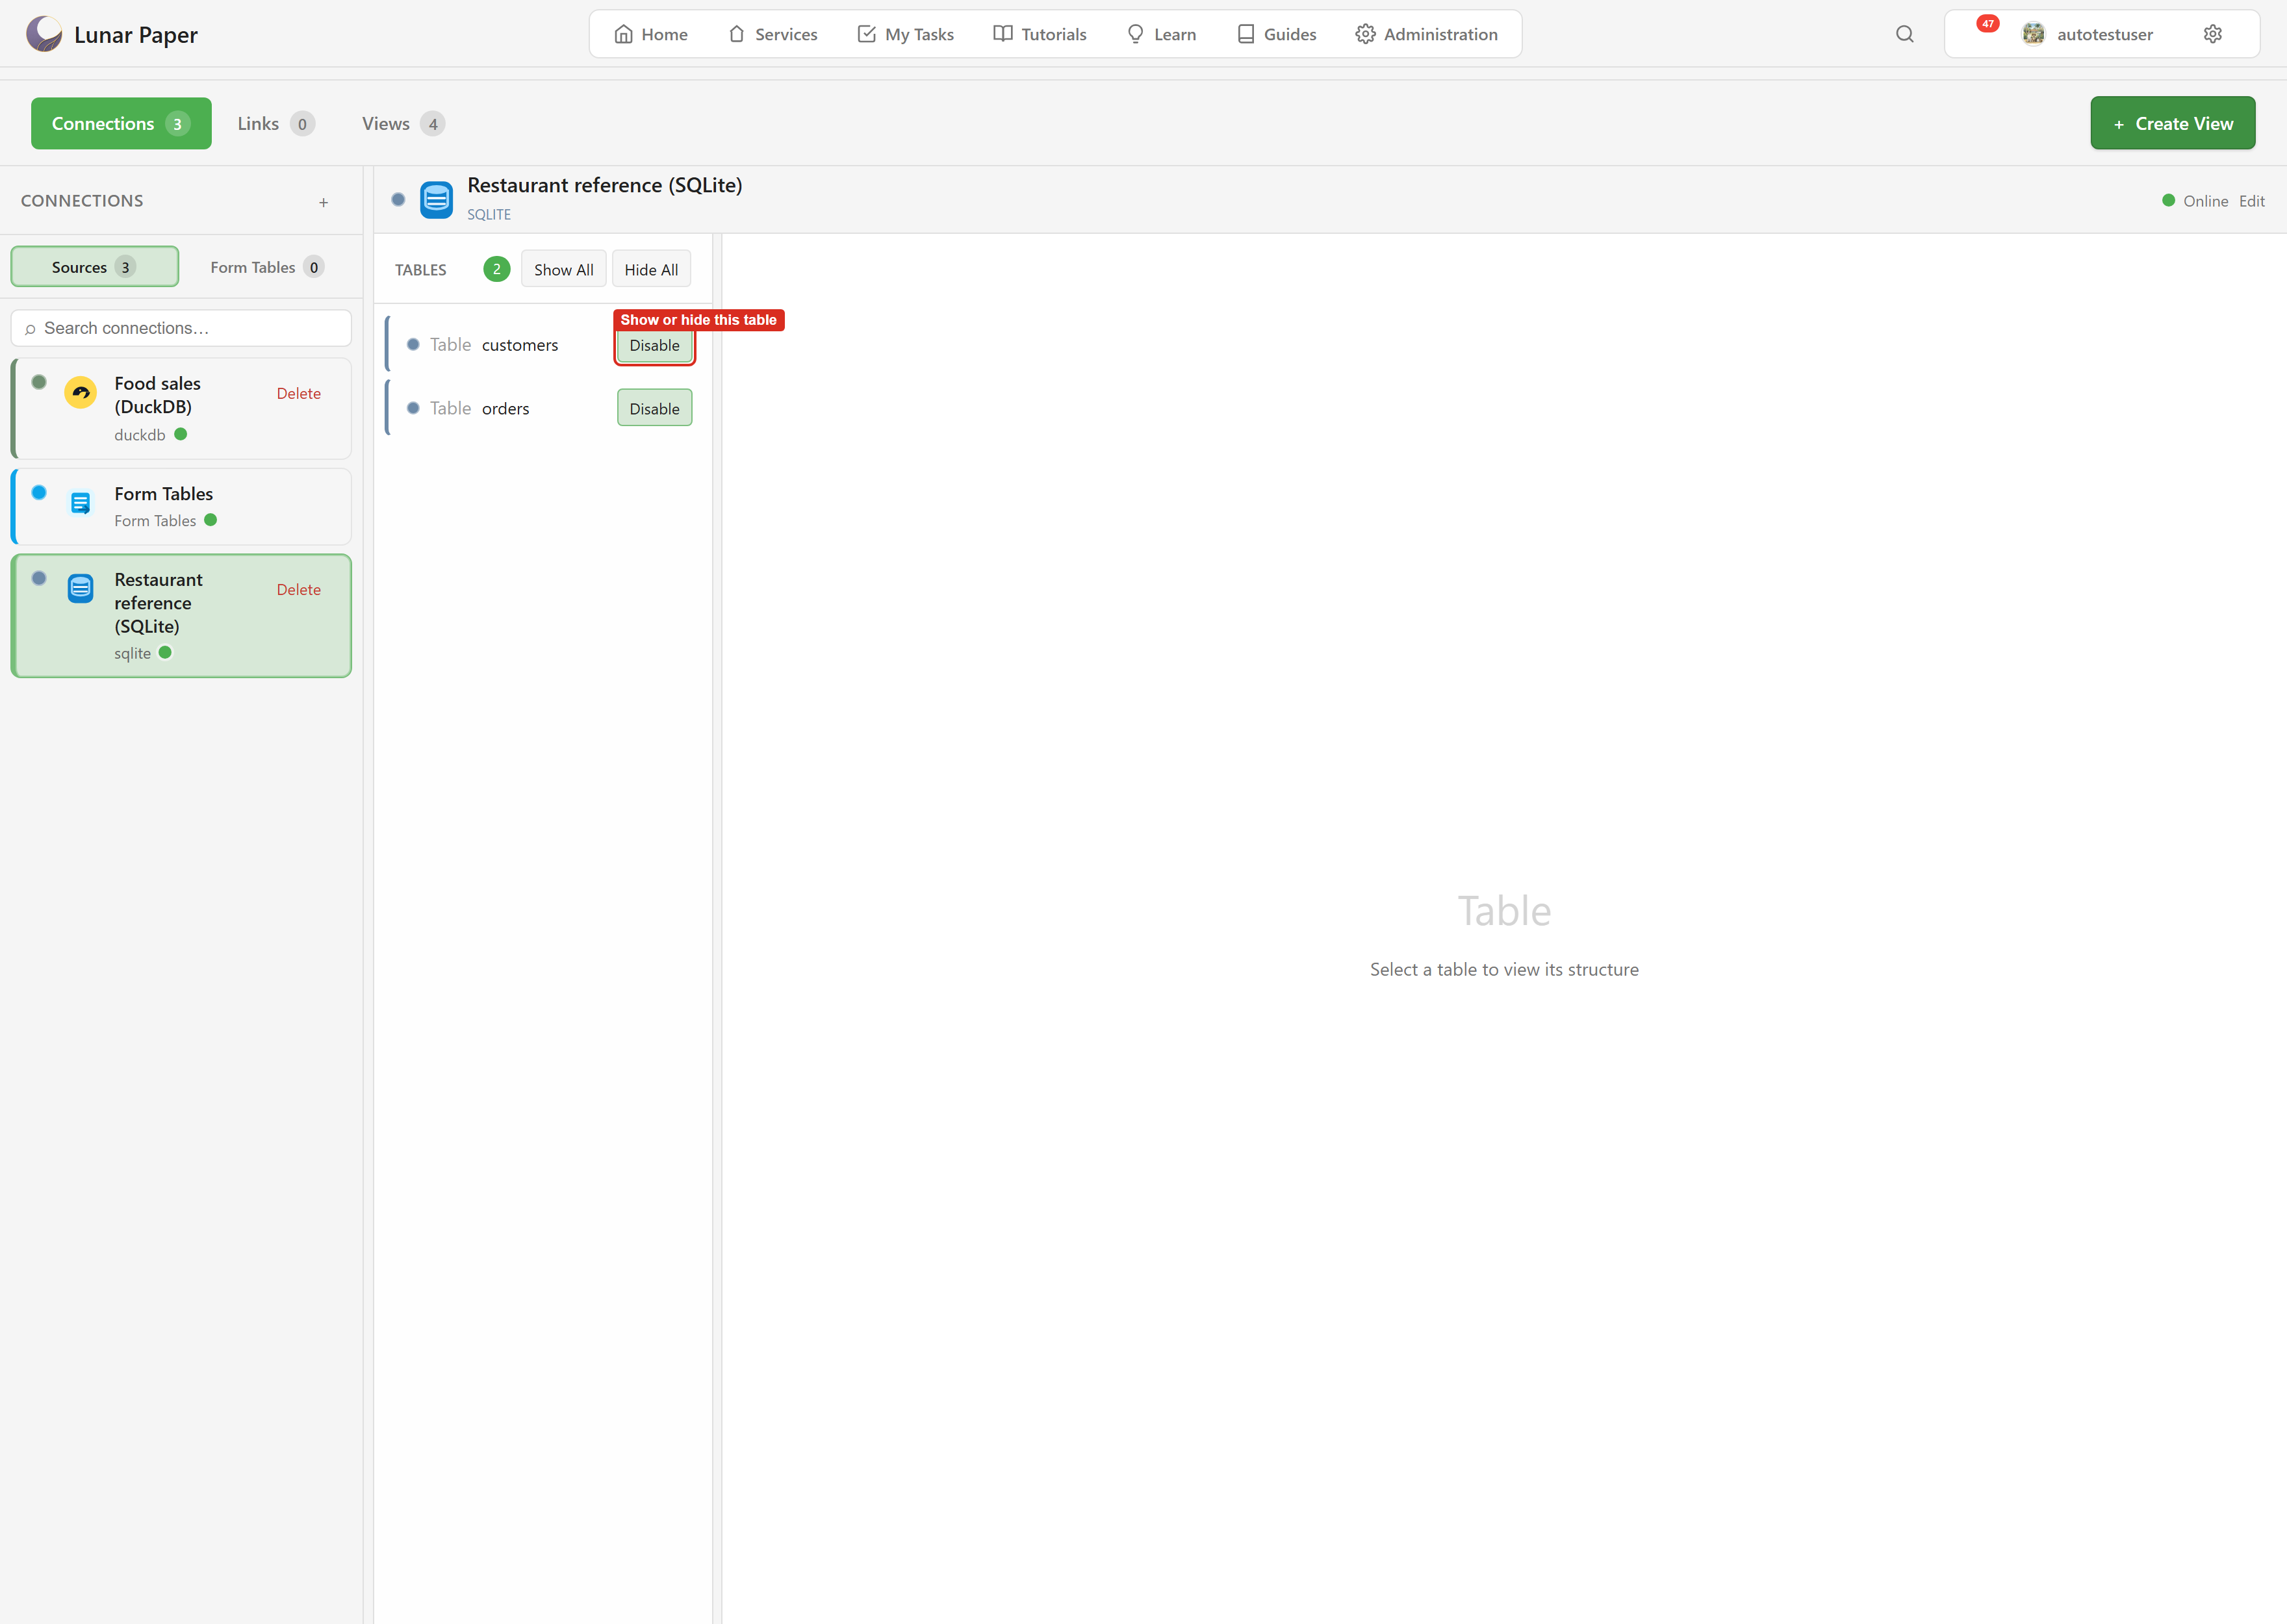
Nothing is usable until you enable it. Enable the tables this service should have, or use Show All if it should have everything.
Enable customers and orders.
Be deliberate here rather than reaching for Show All by default. Every table you expose is one that anyone who can open the service can read.
4. Look at the data
Section titled “4. Look at the data”Select a table.
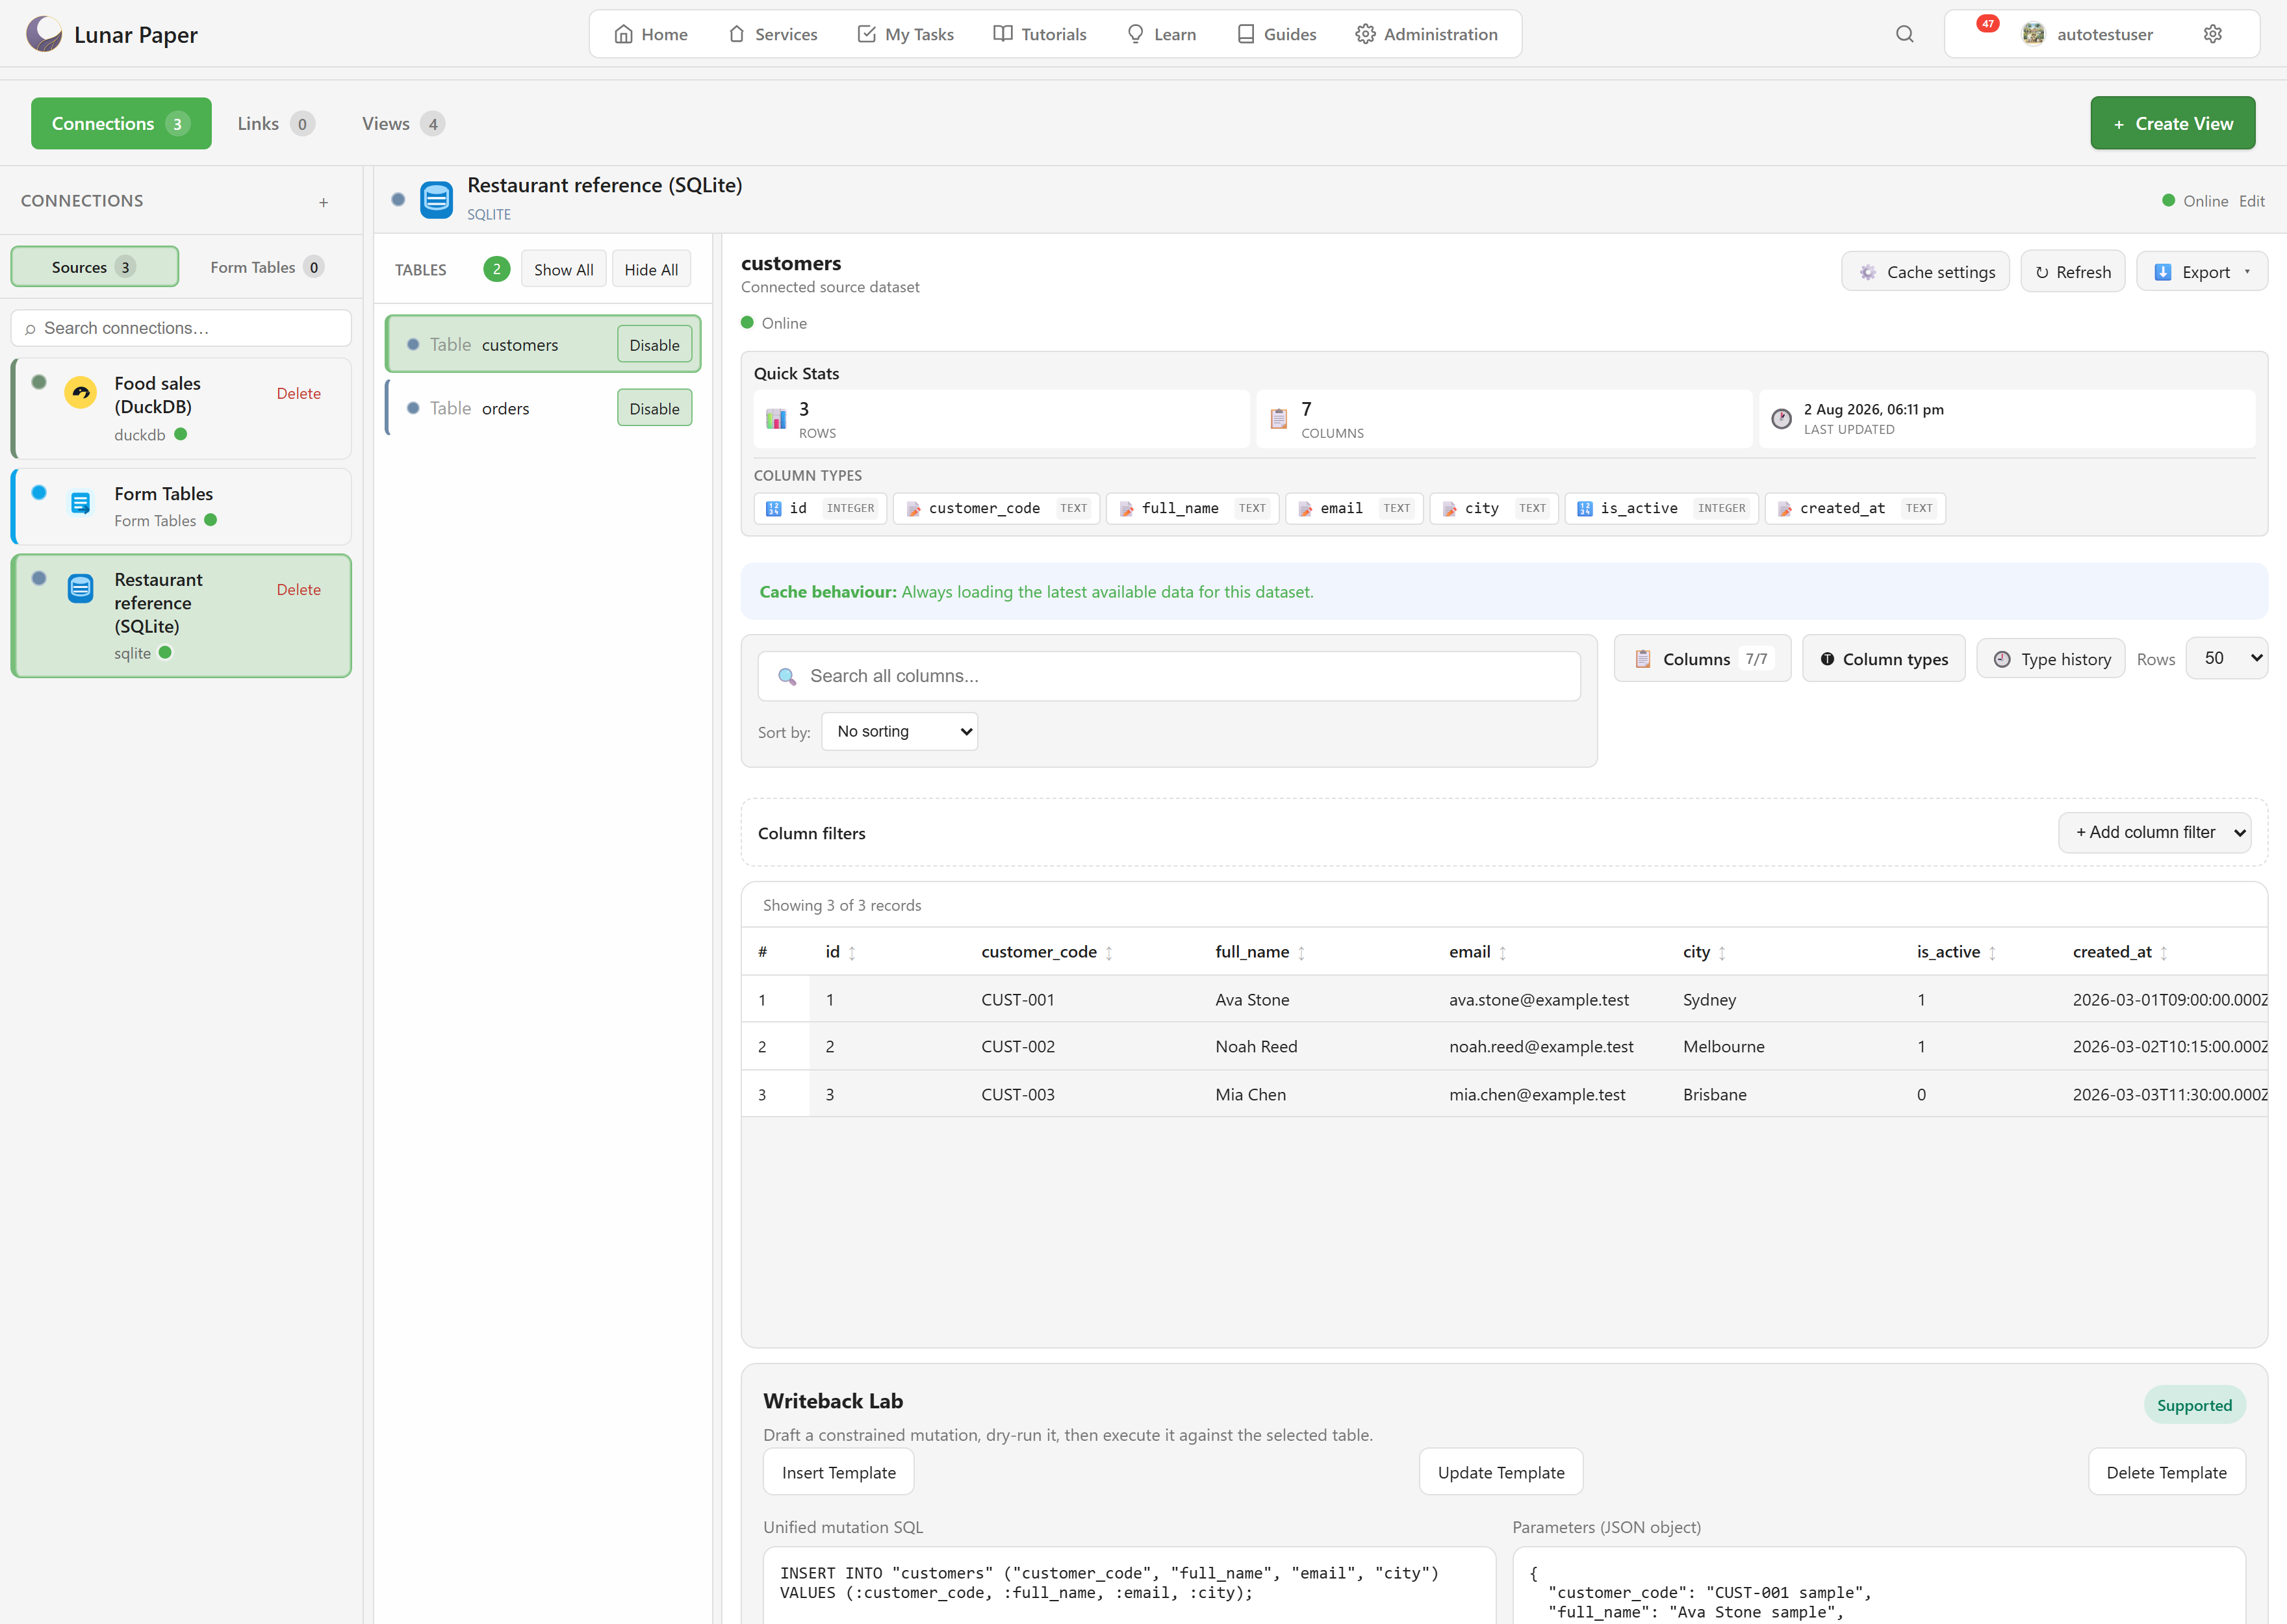
Quick Stats gives you the row count, column count, and when it was last read. Column Types lists every column with its type.
The grid below shows real rows. You can sort, add column filters, choose how many rows to show, and Export the result.
This is the moment to sanity-check what you connected. Wrong row counts and unexpected nulls are much cheaper to find now than in a chart three steps later.
5. Map the relationship
Section titled “5. Map the relationship”Open the Links tab.
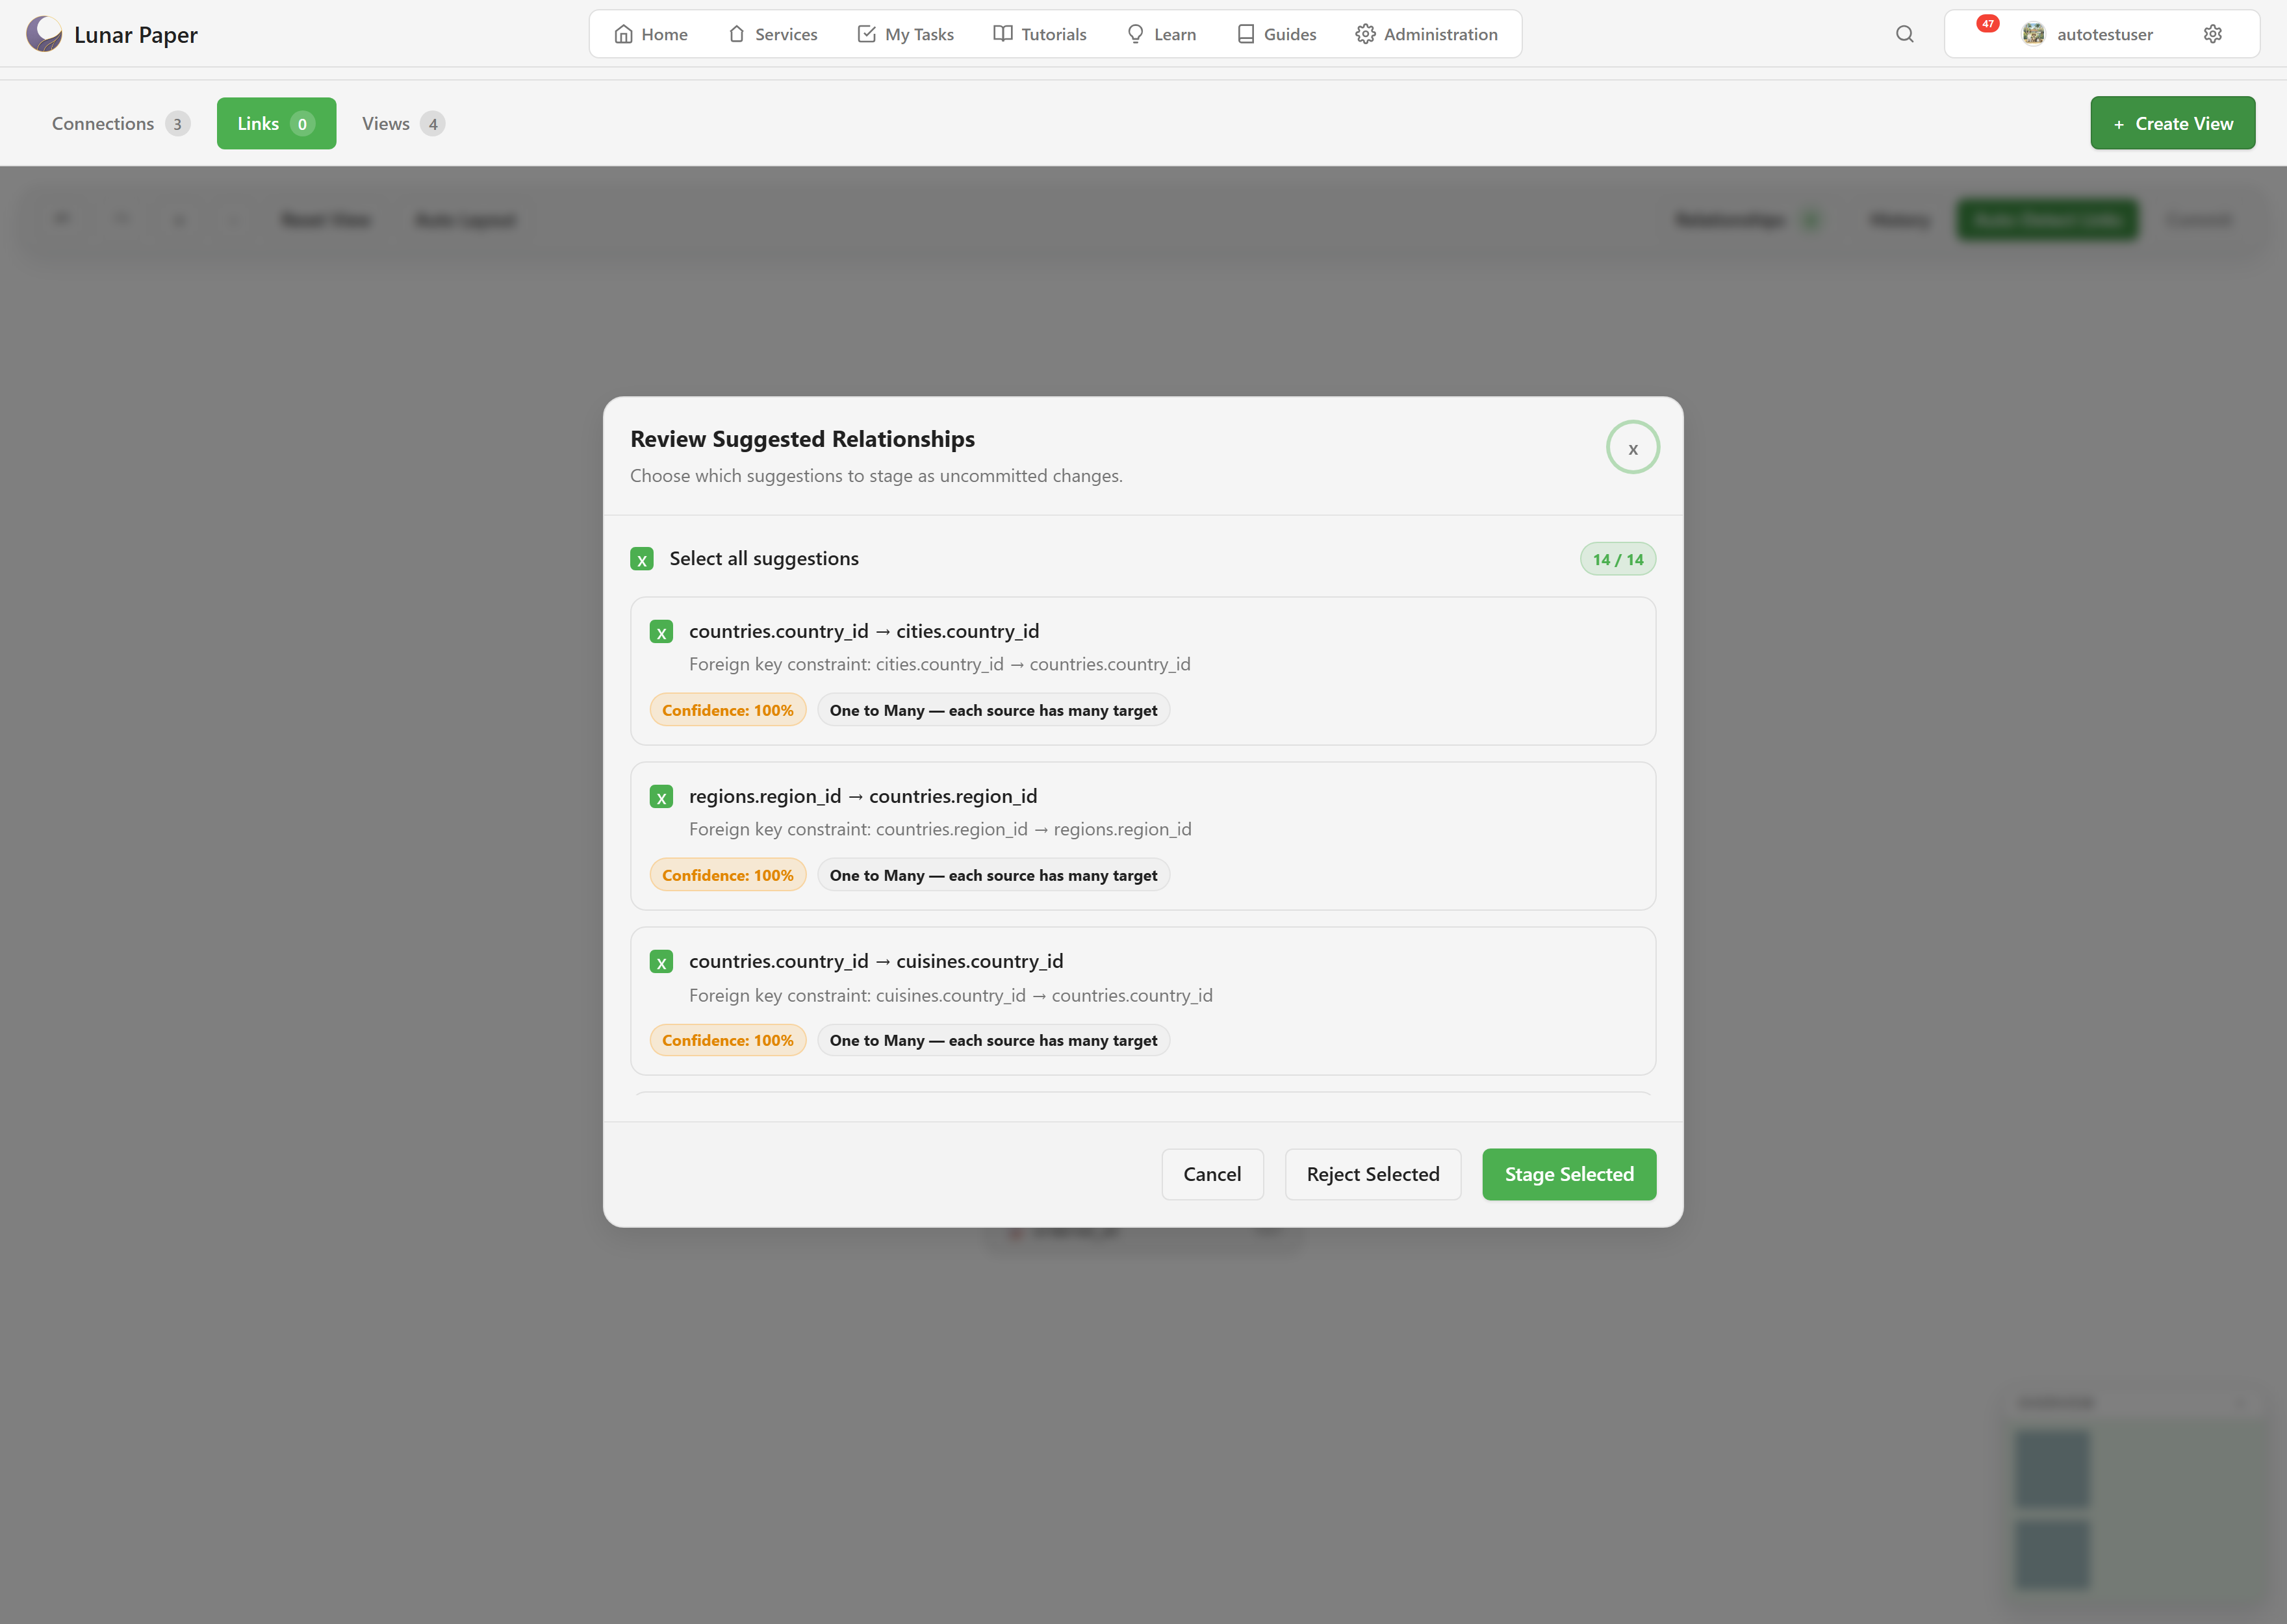
Your enabled tables appear as cards. Auto-Detect Links finds relationships the database already declares — for these two tables, orders.customer_id pointing at customers.id.
Detected relationships are not saved until you Commit them. Until then the counter shows pending changes and leaving the tab asks whether to keep them.
6. Build a view
Section titled “6. Build a view”Open the Views tab and choose + Create View.
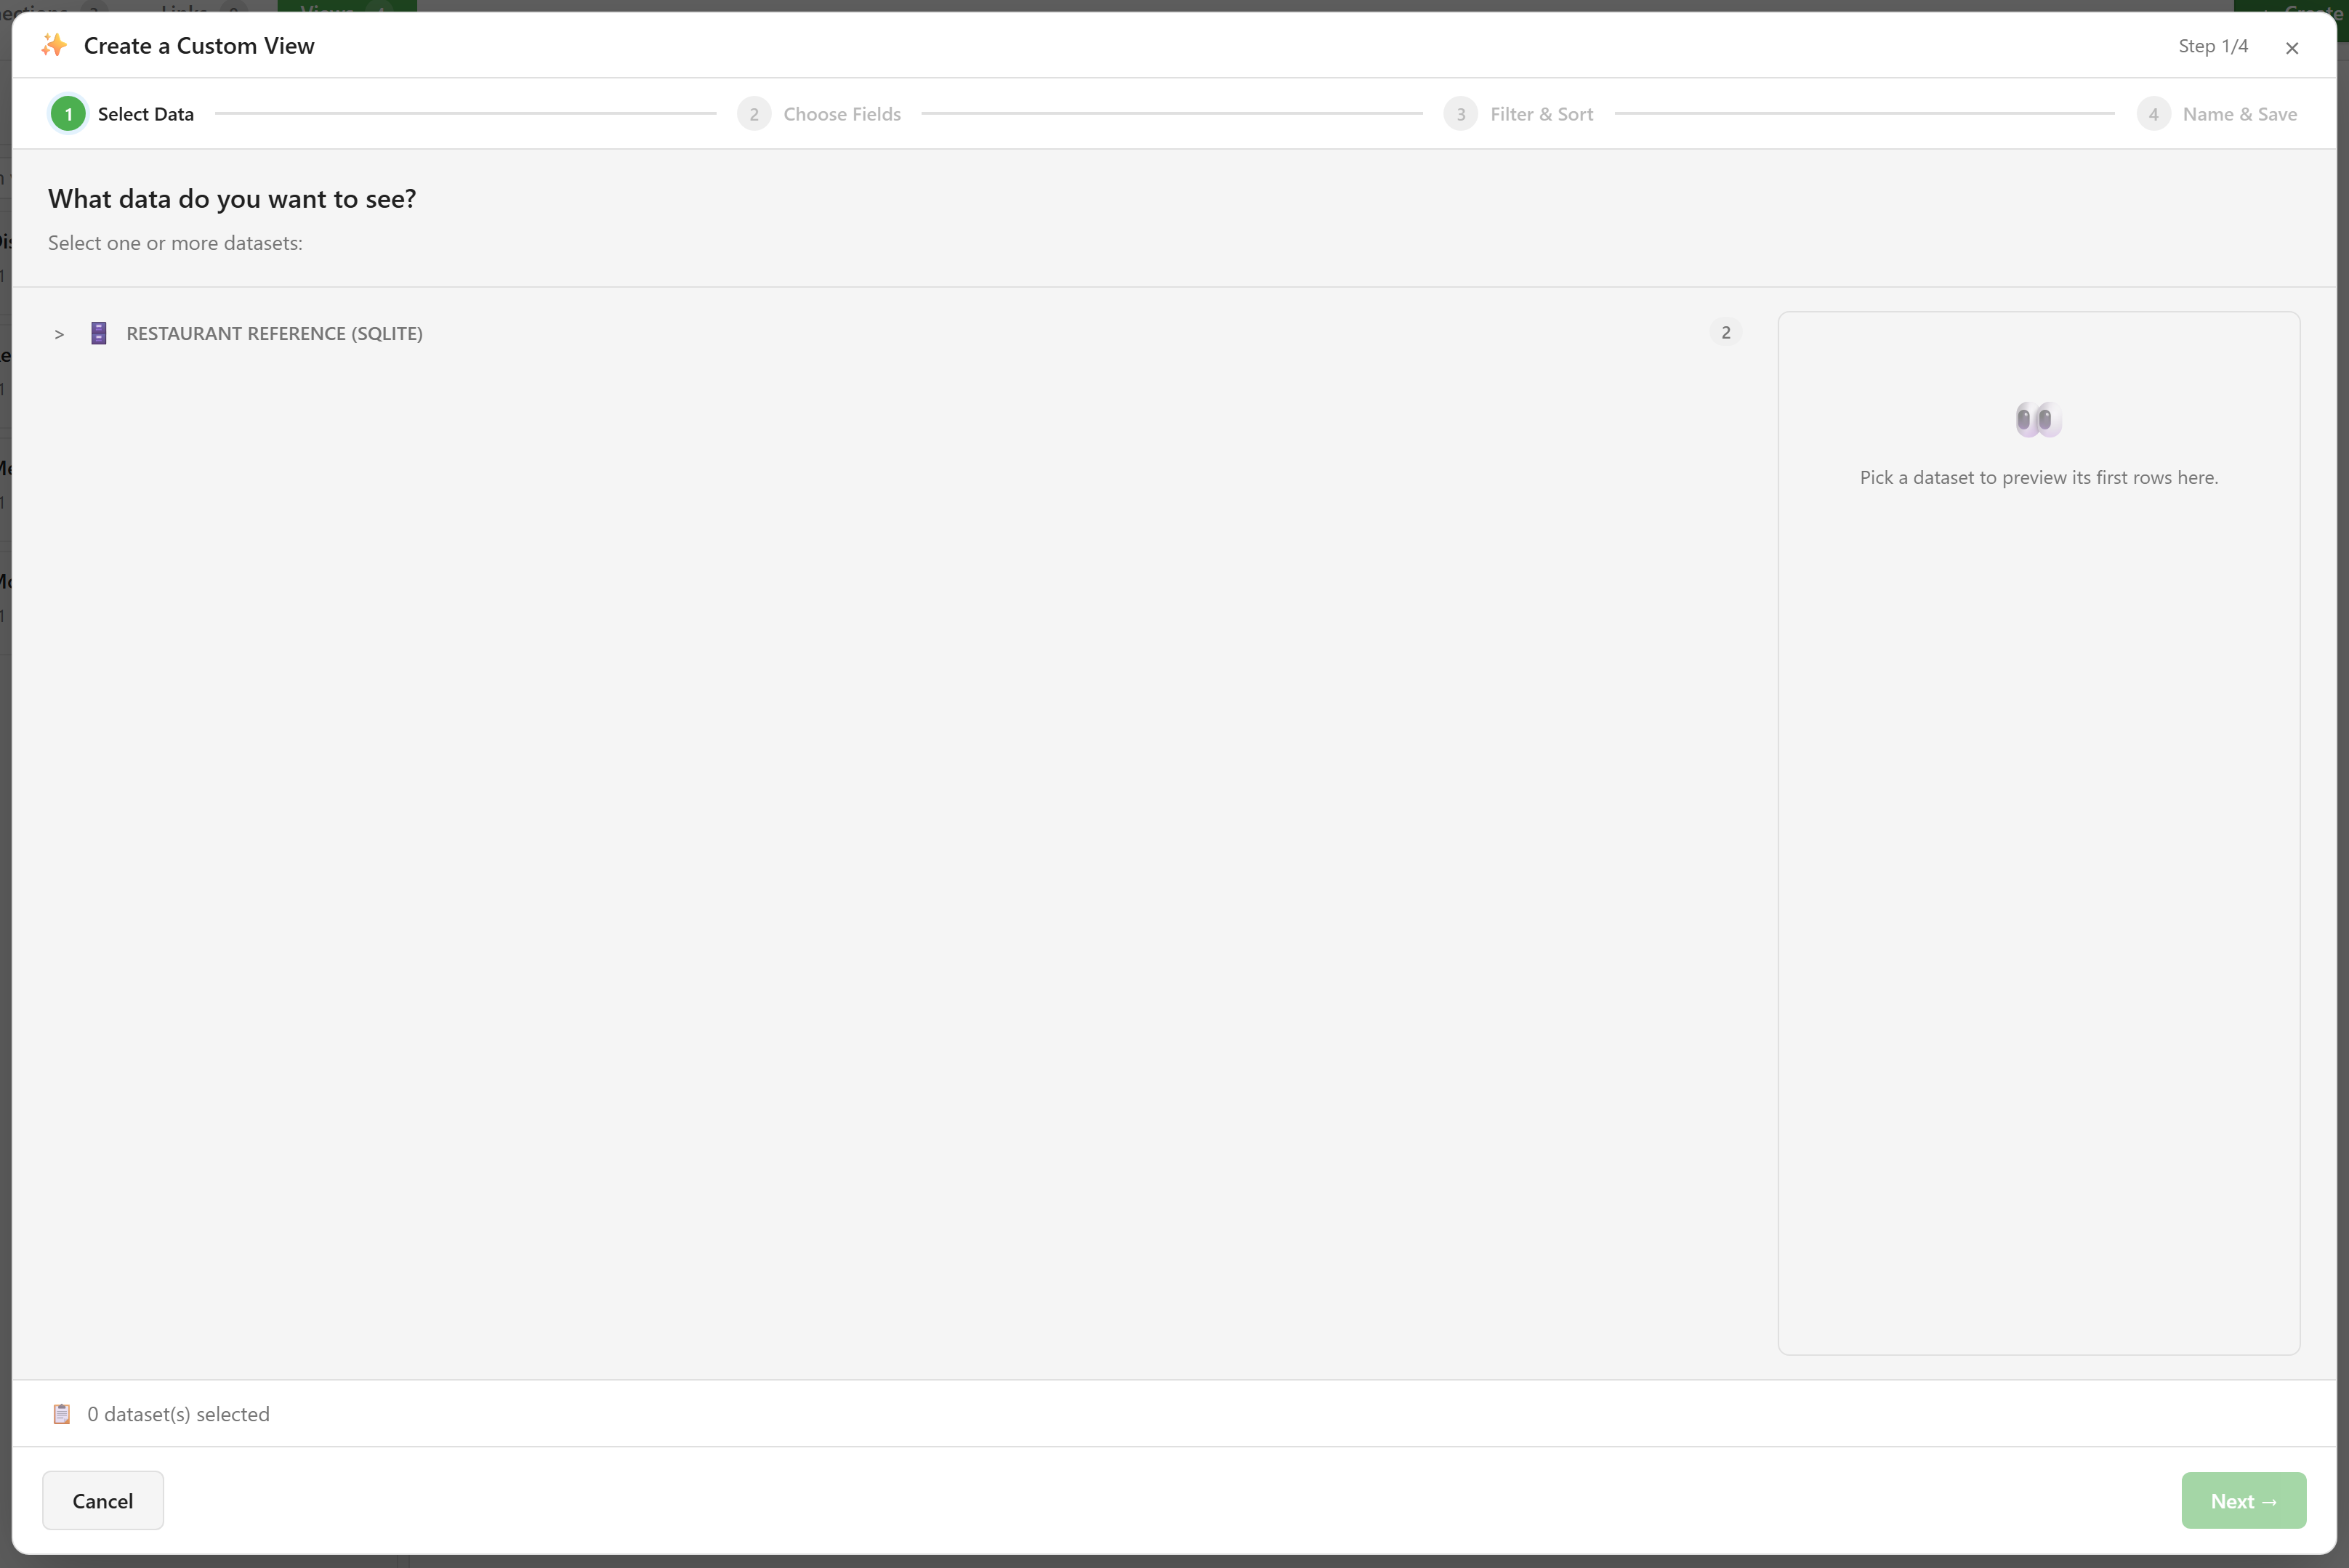
The wizard runs in four steps: Select Data, Choose Fields, Filter & Sort, and Name & Save.
Pick your datasets, keep only the fields that matter, apply any filter that should always apply, then name it for what it contains — “Active customers” rather than “view 2”.
Saving makes it LIVE at v1.
7. Use it elsewhere
Section titled “7. Use it elsewhere”Open Dashboards in the same service. The view now appears in the data panel, grouped under its connection, ready to bind to a widget.
That is the whole point of the chain: shape the data once here, and every chart, report, and export uses the same shape.
What you have
Section titled “What you have”A connection, two exposed tables, a mapped relationship, and a saved view that other modules can read.
Build a view covers the wizard properly, including joins and filters. How data becomes available explains the four stages this quickstart walked through, which is worth reading if any of it did not behave as described.