
Template catalogue
There are 25 templates in eight families. Eleven are marked Recommended and appear under that filter as well as their own.
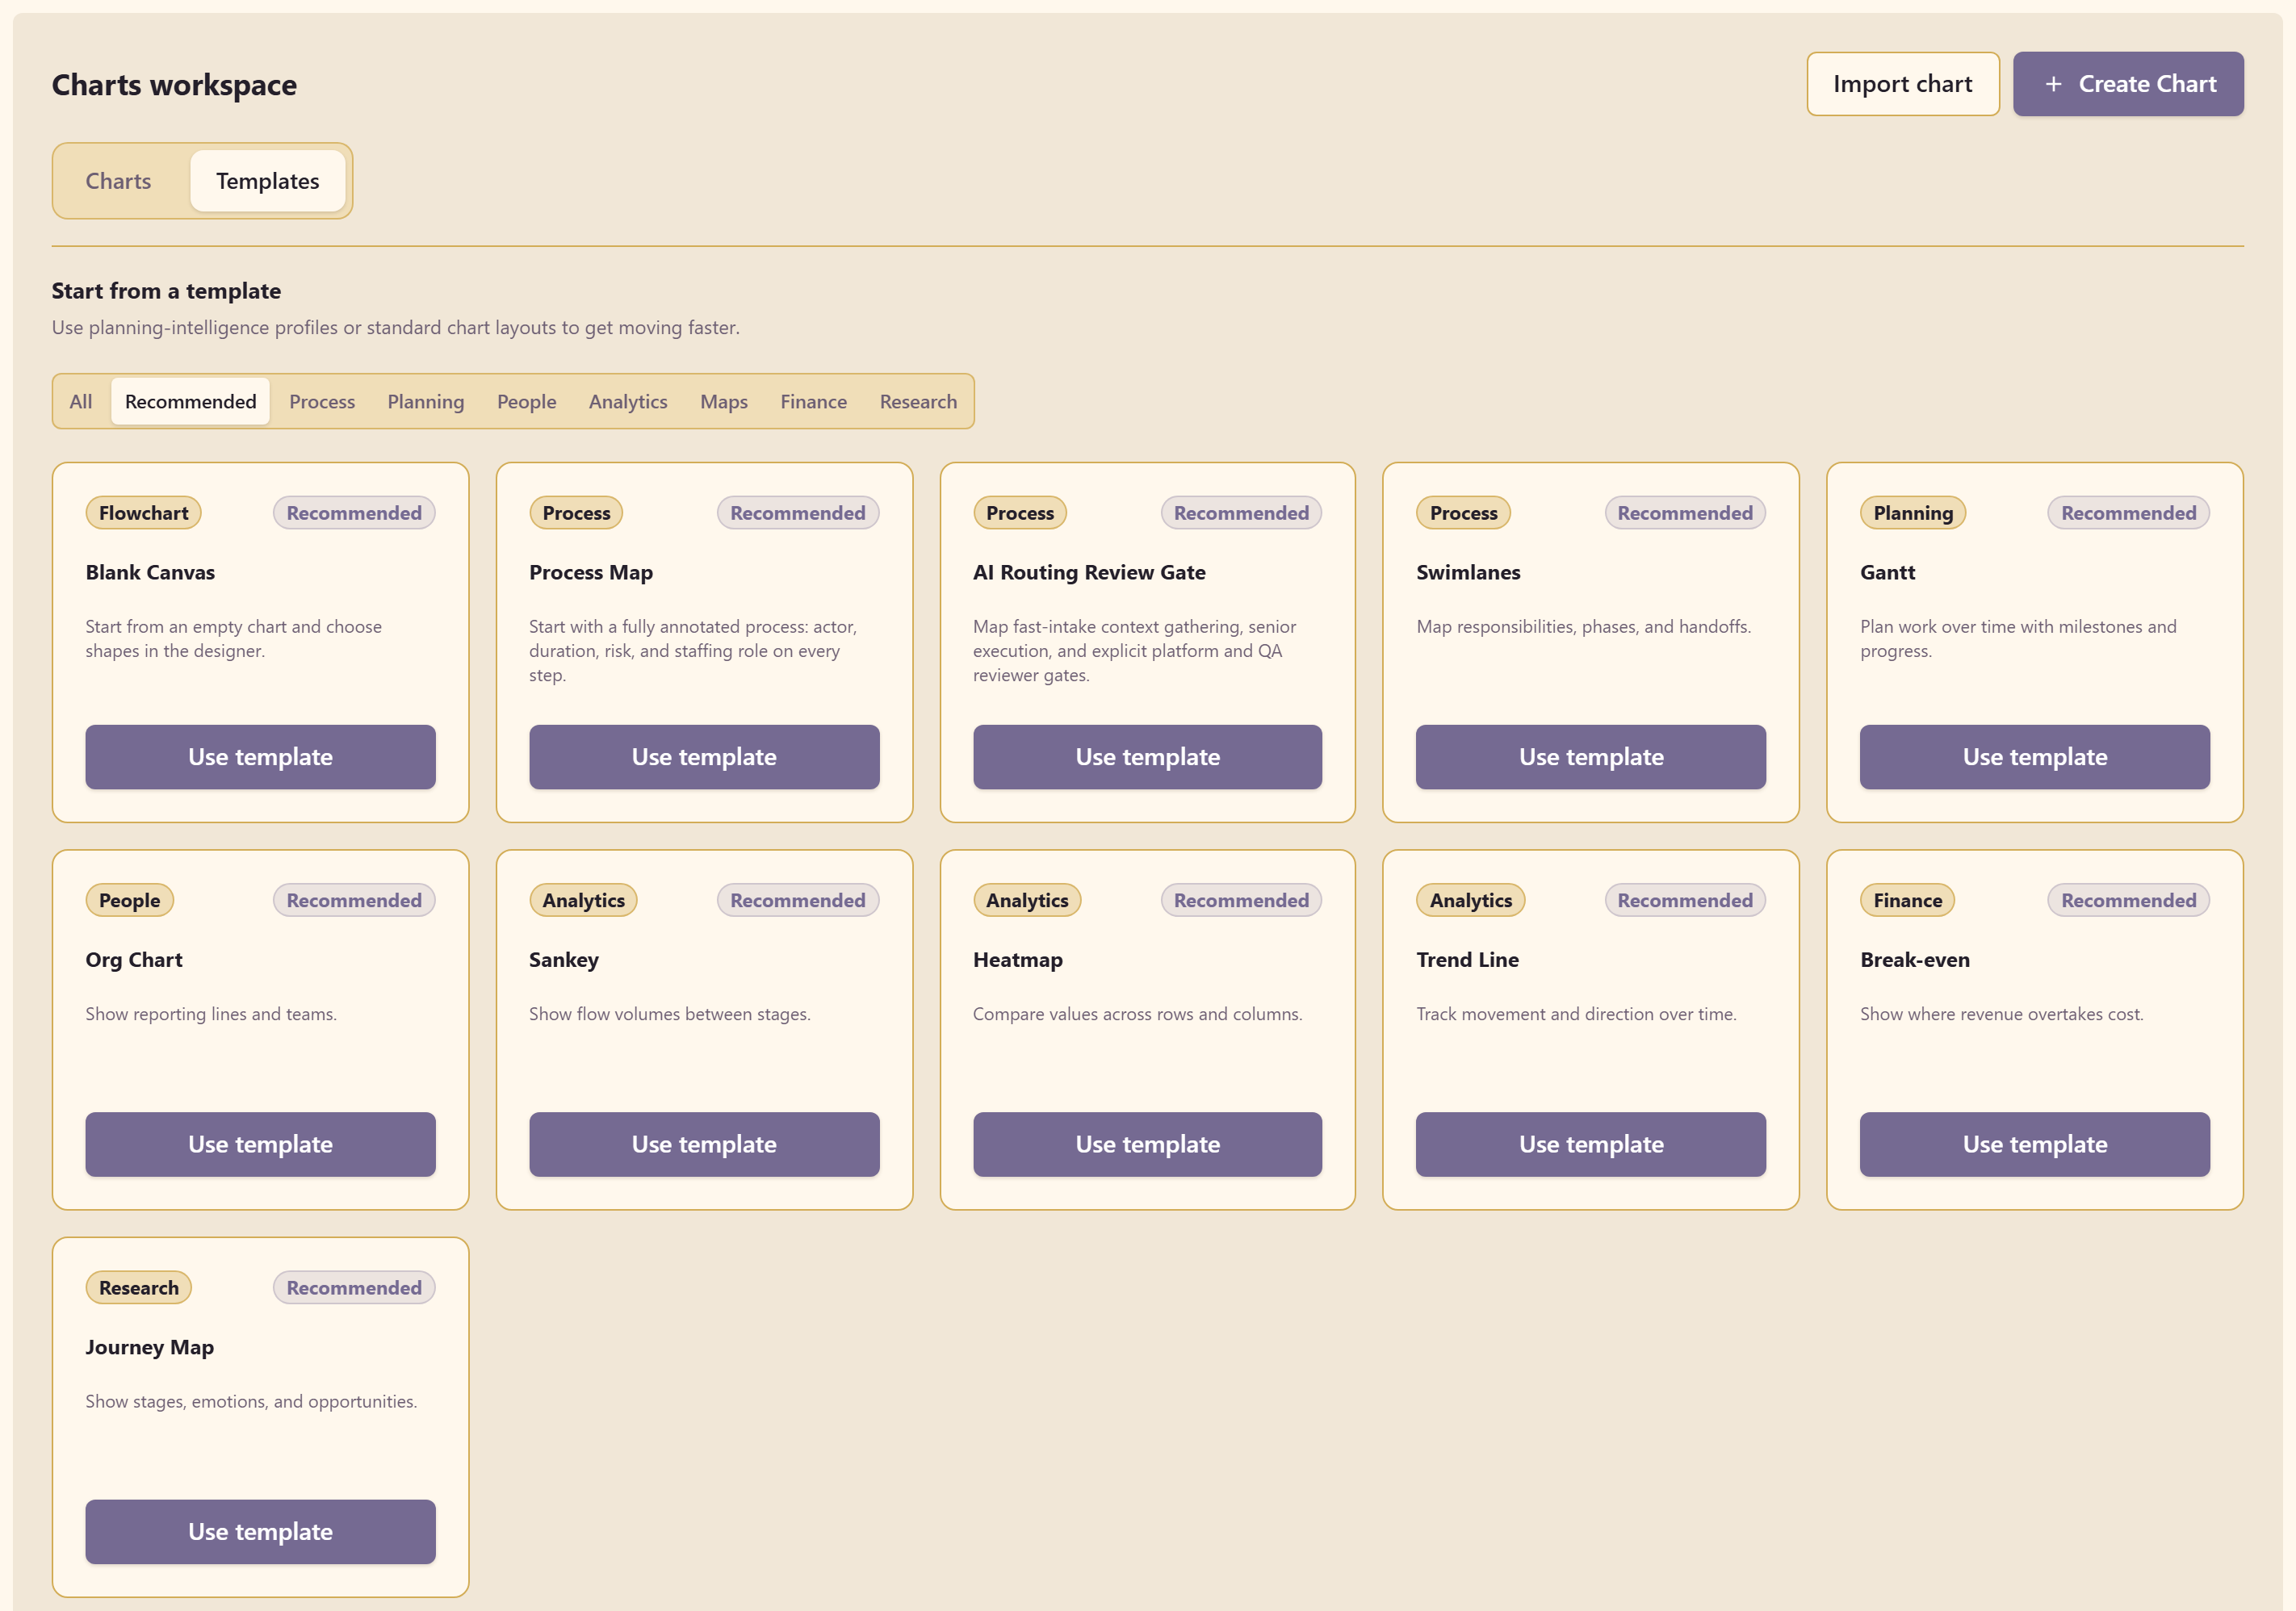
A template creates a chart with content already in it. Everything it adds is an ordinary shape you can edit or delete, so picking one is never a commitment.
Flowchart
Section titled “Flowchart”| Template | What you get |
|---|---|
| Blank Canvas ★ | An empty chart |
Process
Section titled “Process”| Template | What you get |
|---|---|
| Process Map ★ | A working process with an actor, duration, risk, and staffing role on every step |
| AI Routing Review Gate ★ | Fast intake, senior execution, and explicit platform and QA reviewer gates |
| Swimlanes ★ | Responsibilities, phases, and handoffs |
Process Map is the best starting point for learning the module, because it arrives fully annotated and shows what good step data looks like.
Planning
Section titled “Planning”| Template | What you get |
|---|---|
| Gantt ★ | Work over time, with milestones and progress |
| PERT | Dependencies and the critical path |
| Timeline | Milestones laid out across a timeline |
People
Section titled “People”| Template | What you get |
|---|---|
| Org Chart ★ | Reporting lines and teams |
Analytics
Section titled “Analytics”| Template | What you get |
|---|---|
| Sankey ★ | Flow volumes between stages |
| Heatmap ★ | Values compared across rows and columns |
| Trend Line ★ | Movement and direction over time |
| Fan Chart | Baseline forecasts with confidence bands |
| Template | What you get |
|---|---|
| Bubble Map | Sized markers across a map surface |
| Connection Map | Flows and relationships between locations |
| Choropleth | Regions coloured by value |
Finance
Section titled “Finance”The largest family, with six templates.
| Template | What you get |
|---|---|
| Waterfall | How changes build to a final result |
| Variance | Actuals against plan or budget |
| Cash Flow | Inflows, outflows, and a running balance |
| Income Statement | Performance broken down across periods |
| Break-even ★ | Where revenue overtakes cost |
| Aging | Balances by overdue bucket |
Research
Section titled “Research”| Template | What you get |
|---|---|
| Empathy Map | What a user says, thinks, does, and feels |
| Storyboard | Scenes and touchpoints in sequence |
| Journey Map ★ | Stages, emotions, and opportunities |
| Persona Card | Goals, frustrations, and traits in one card |
What some of them look like
Section titled “What some of them look like”Four of the templates, filled in with realistic content.
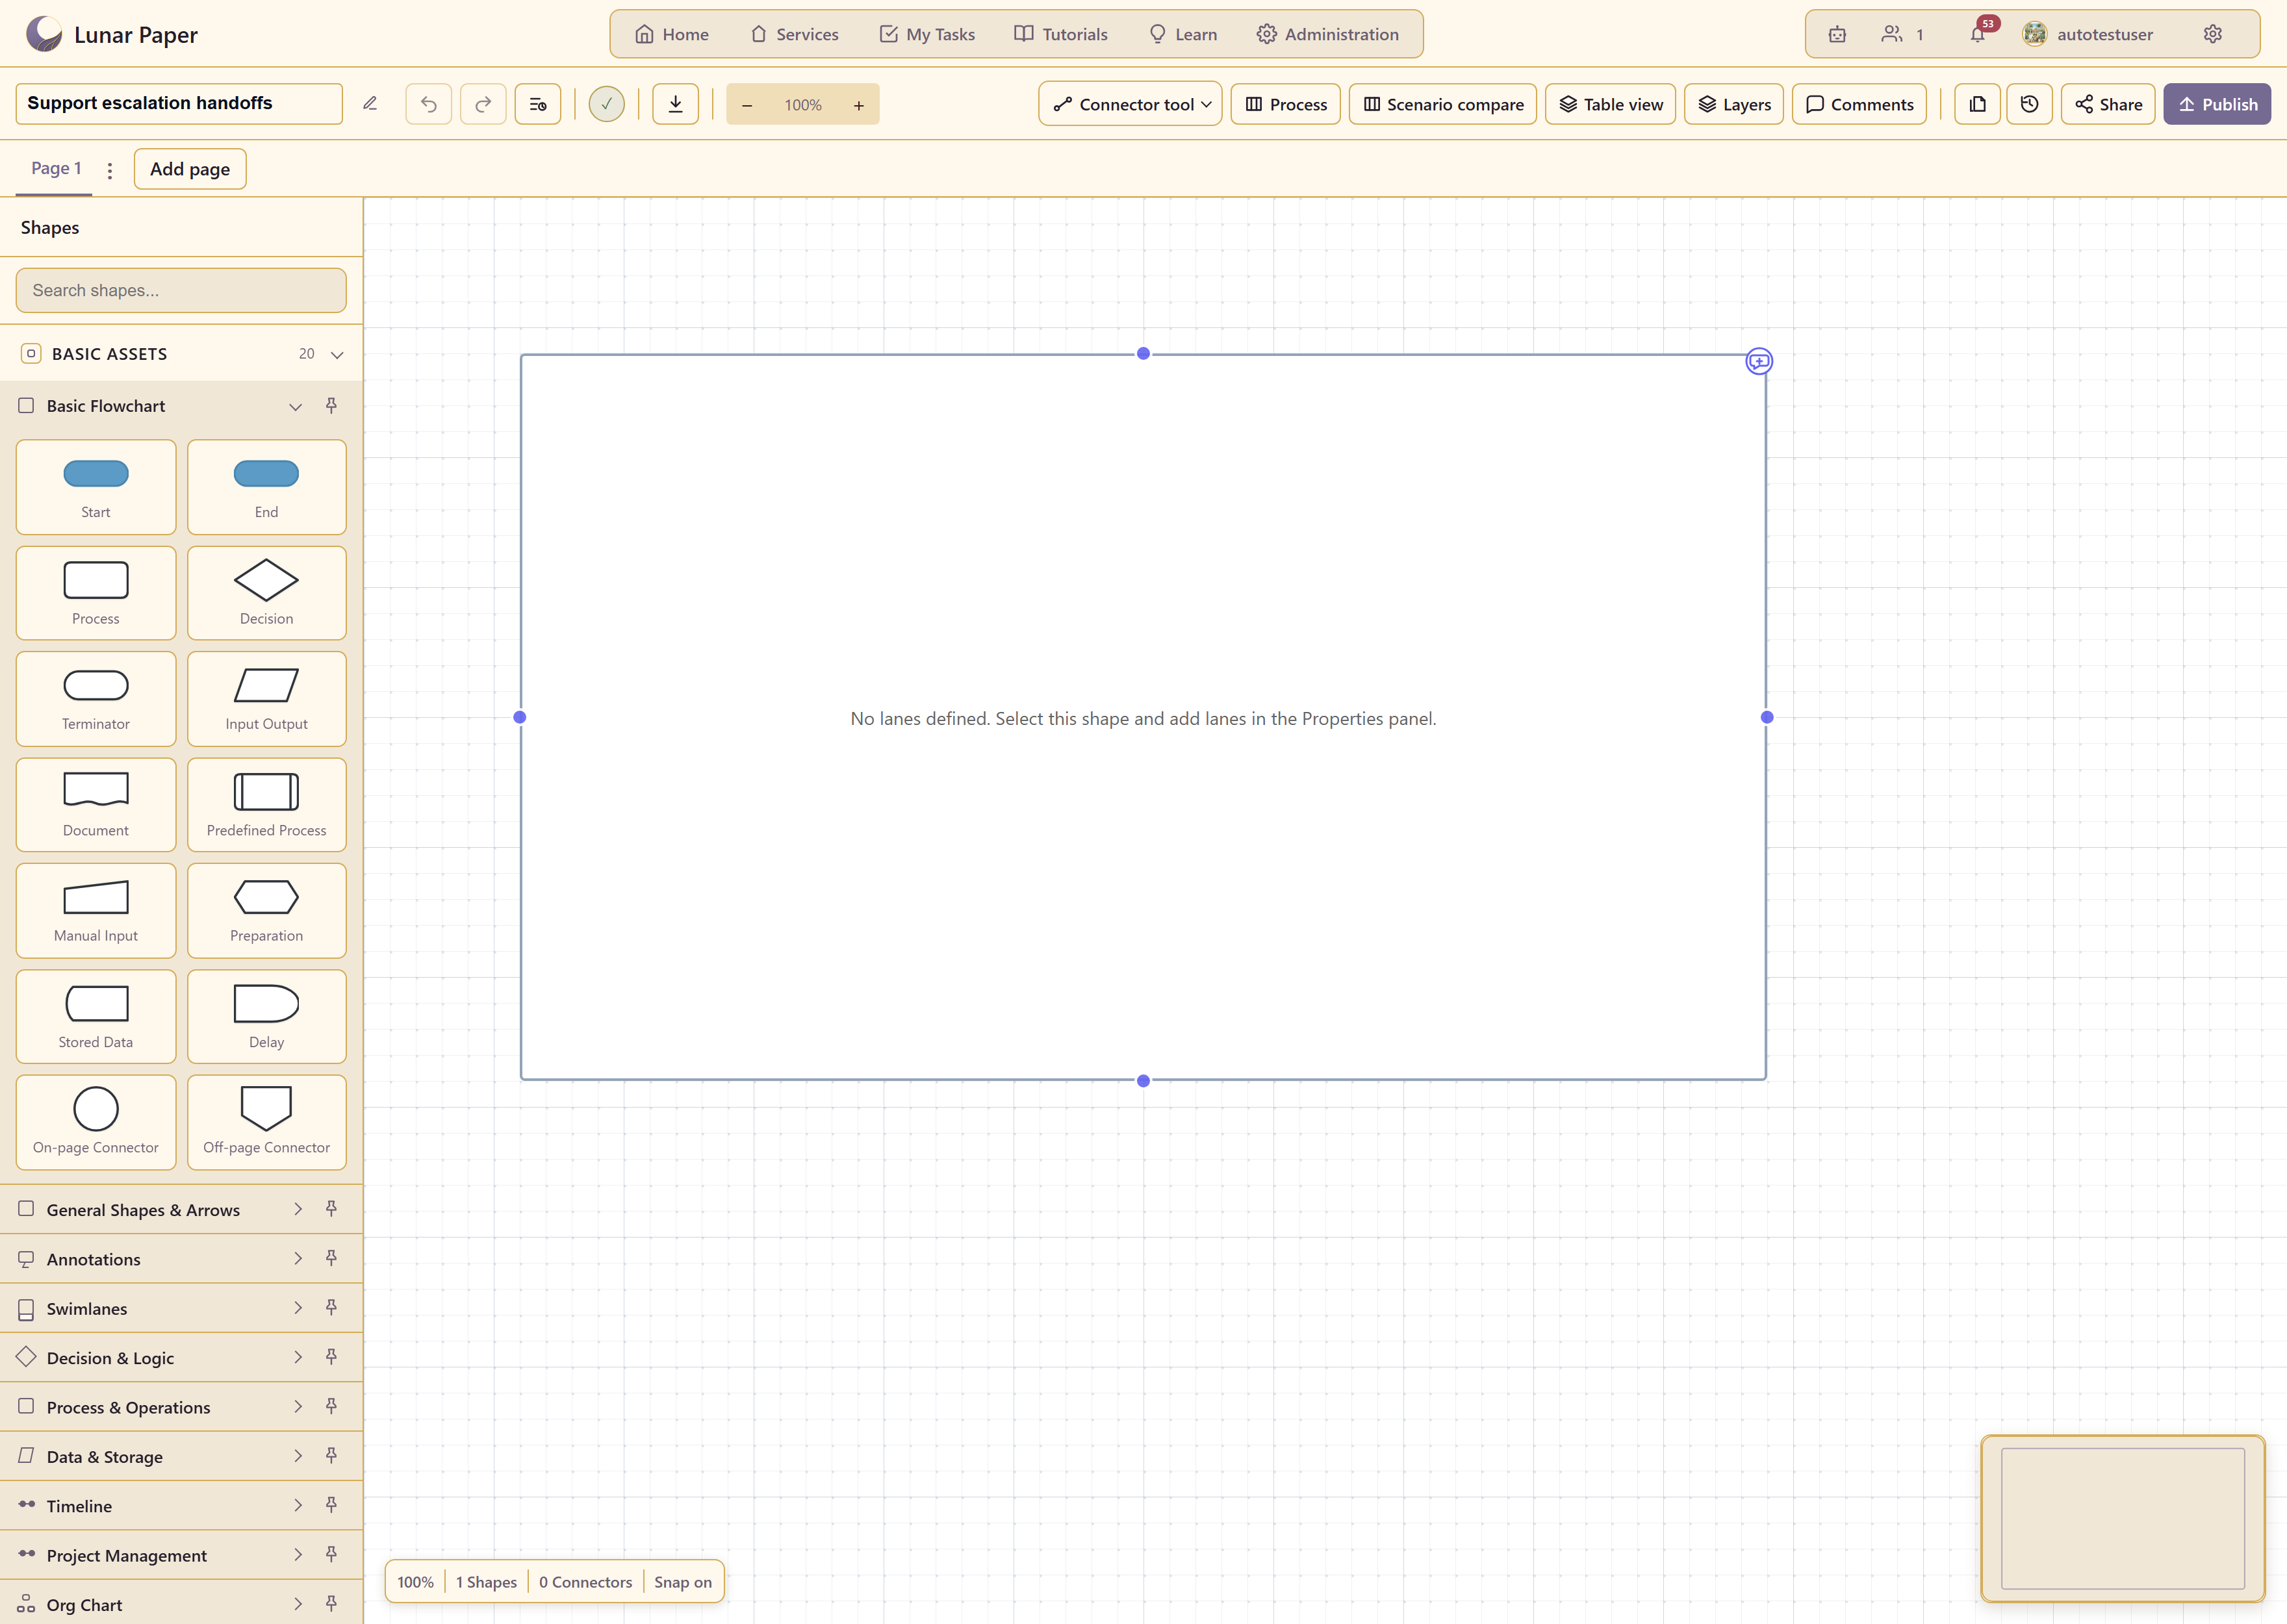
Swimlanes — responsibilities and handoffs across teams.
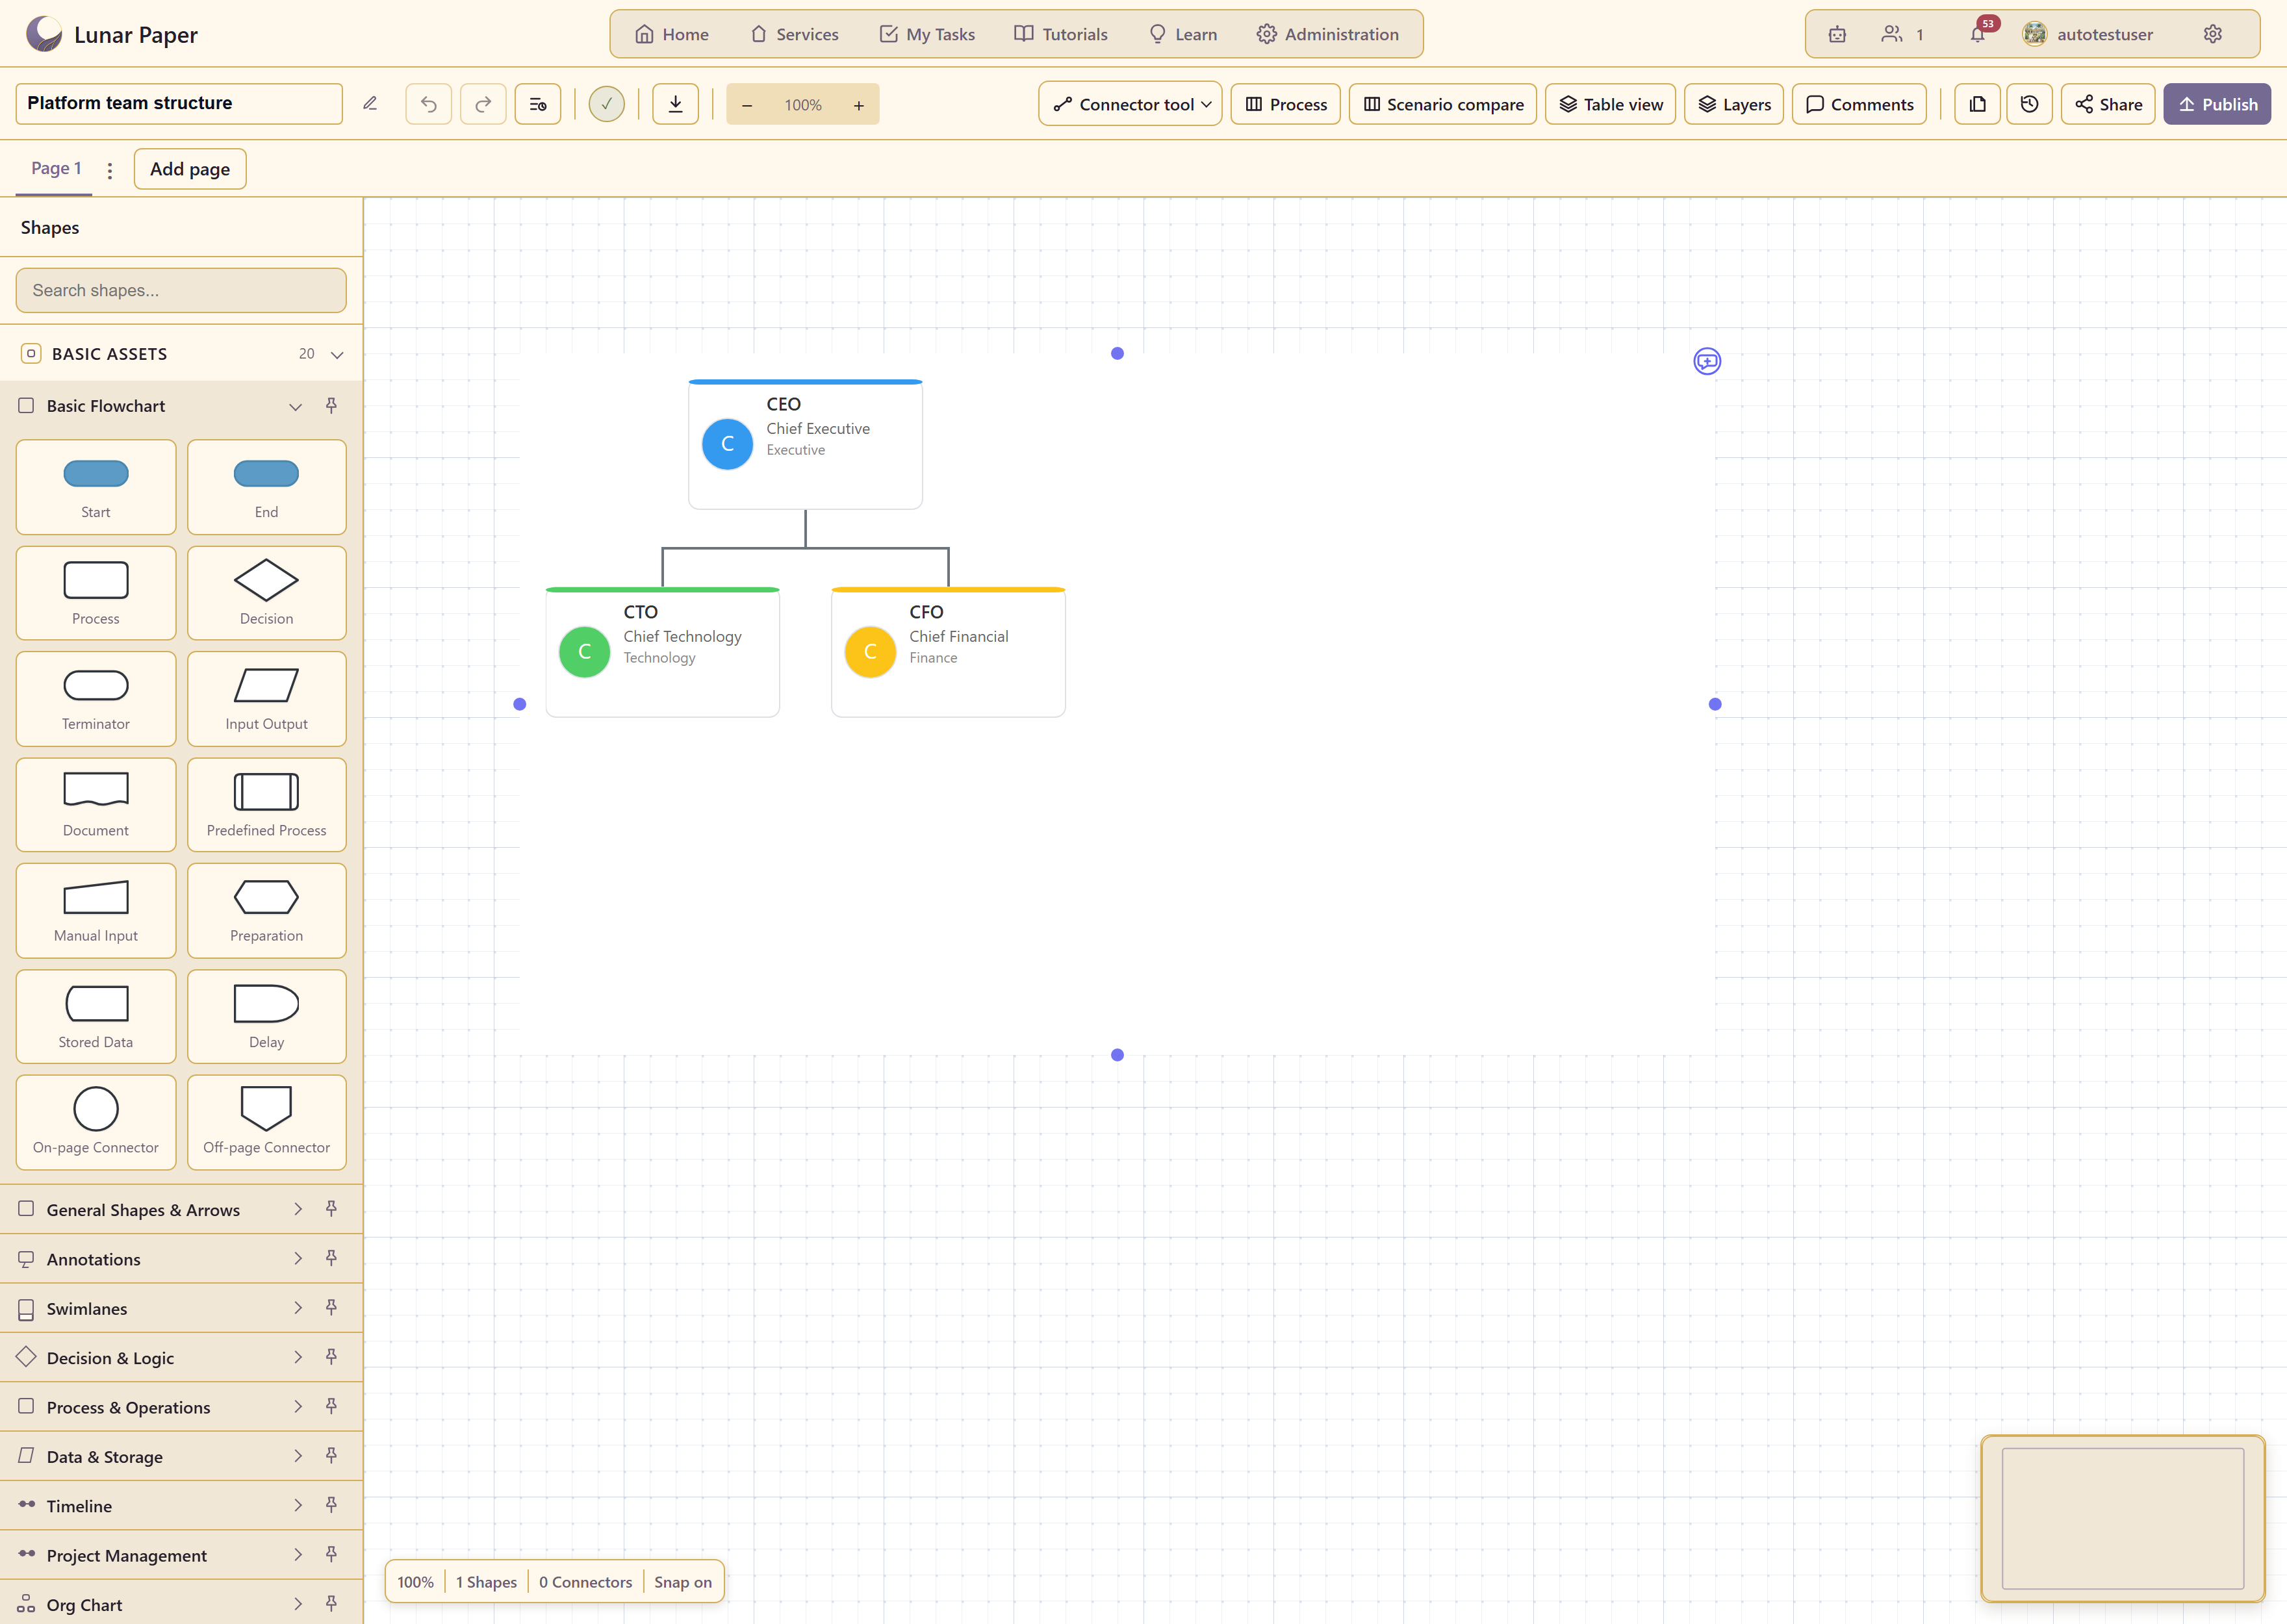
Org Chart — reporting lines.
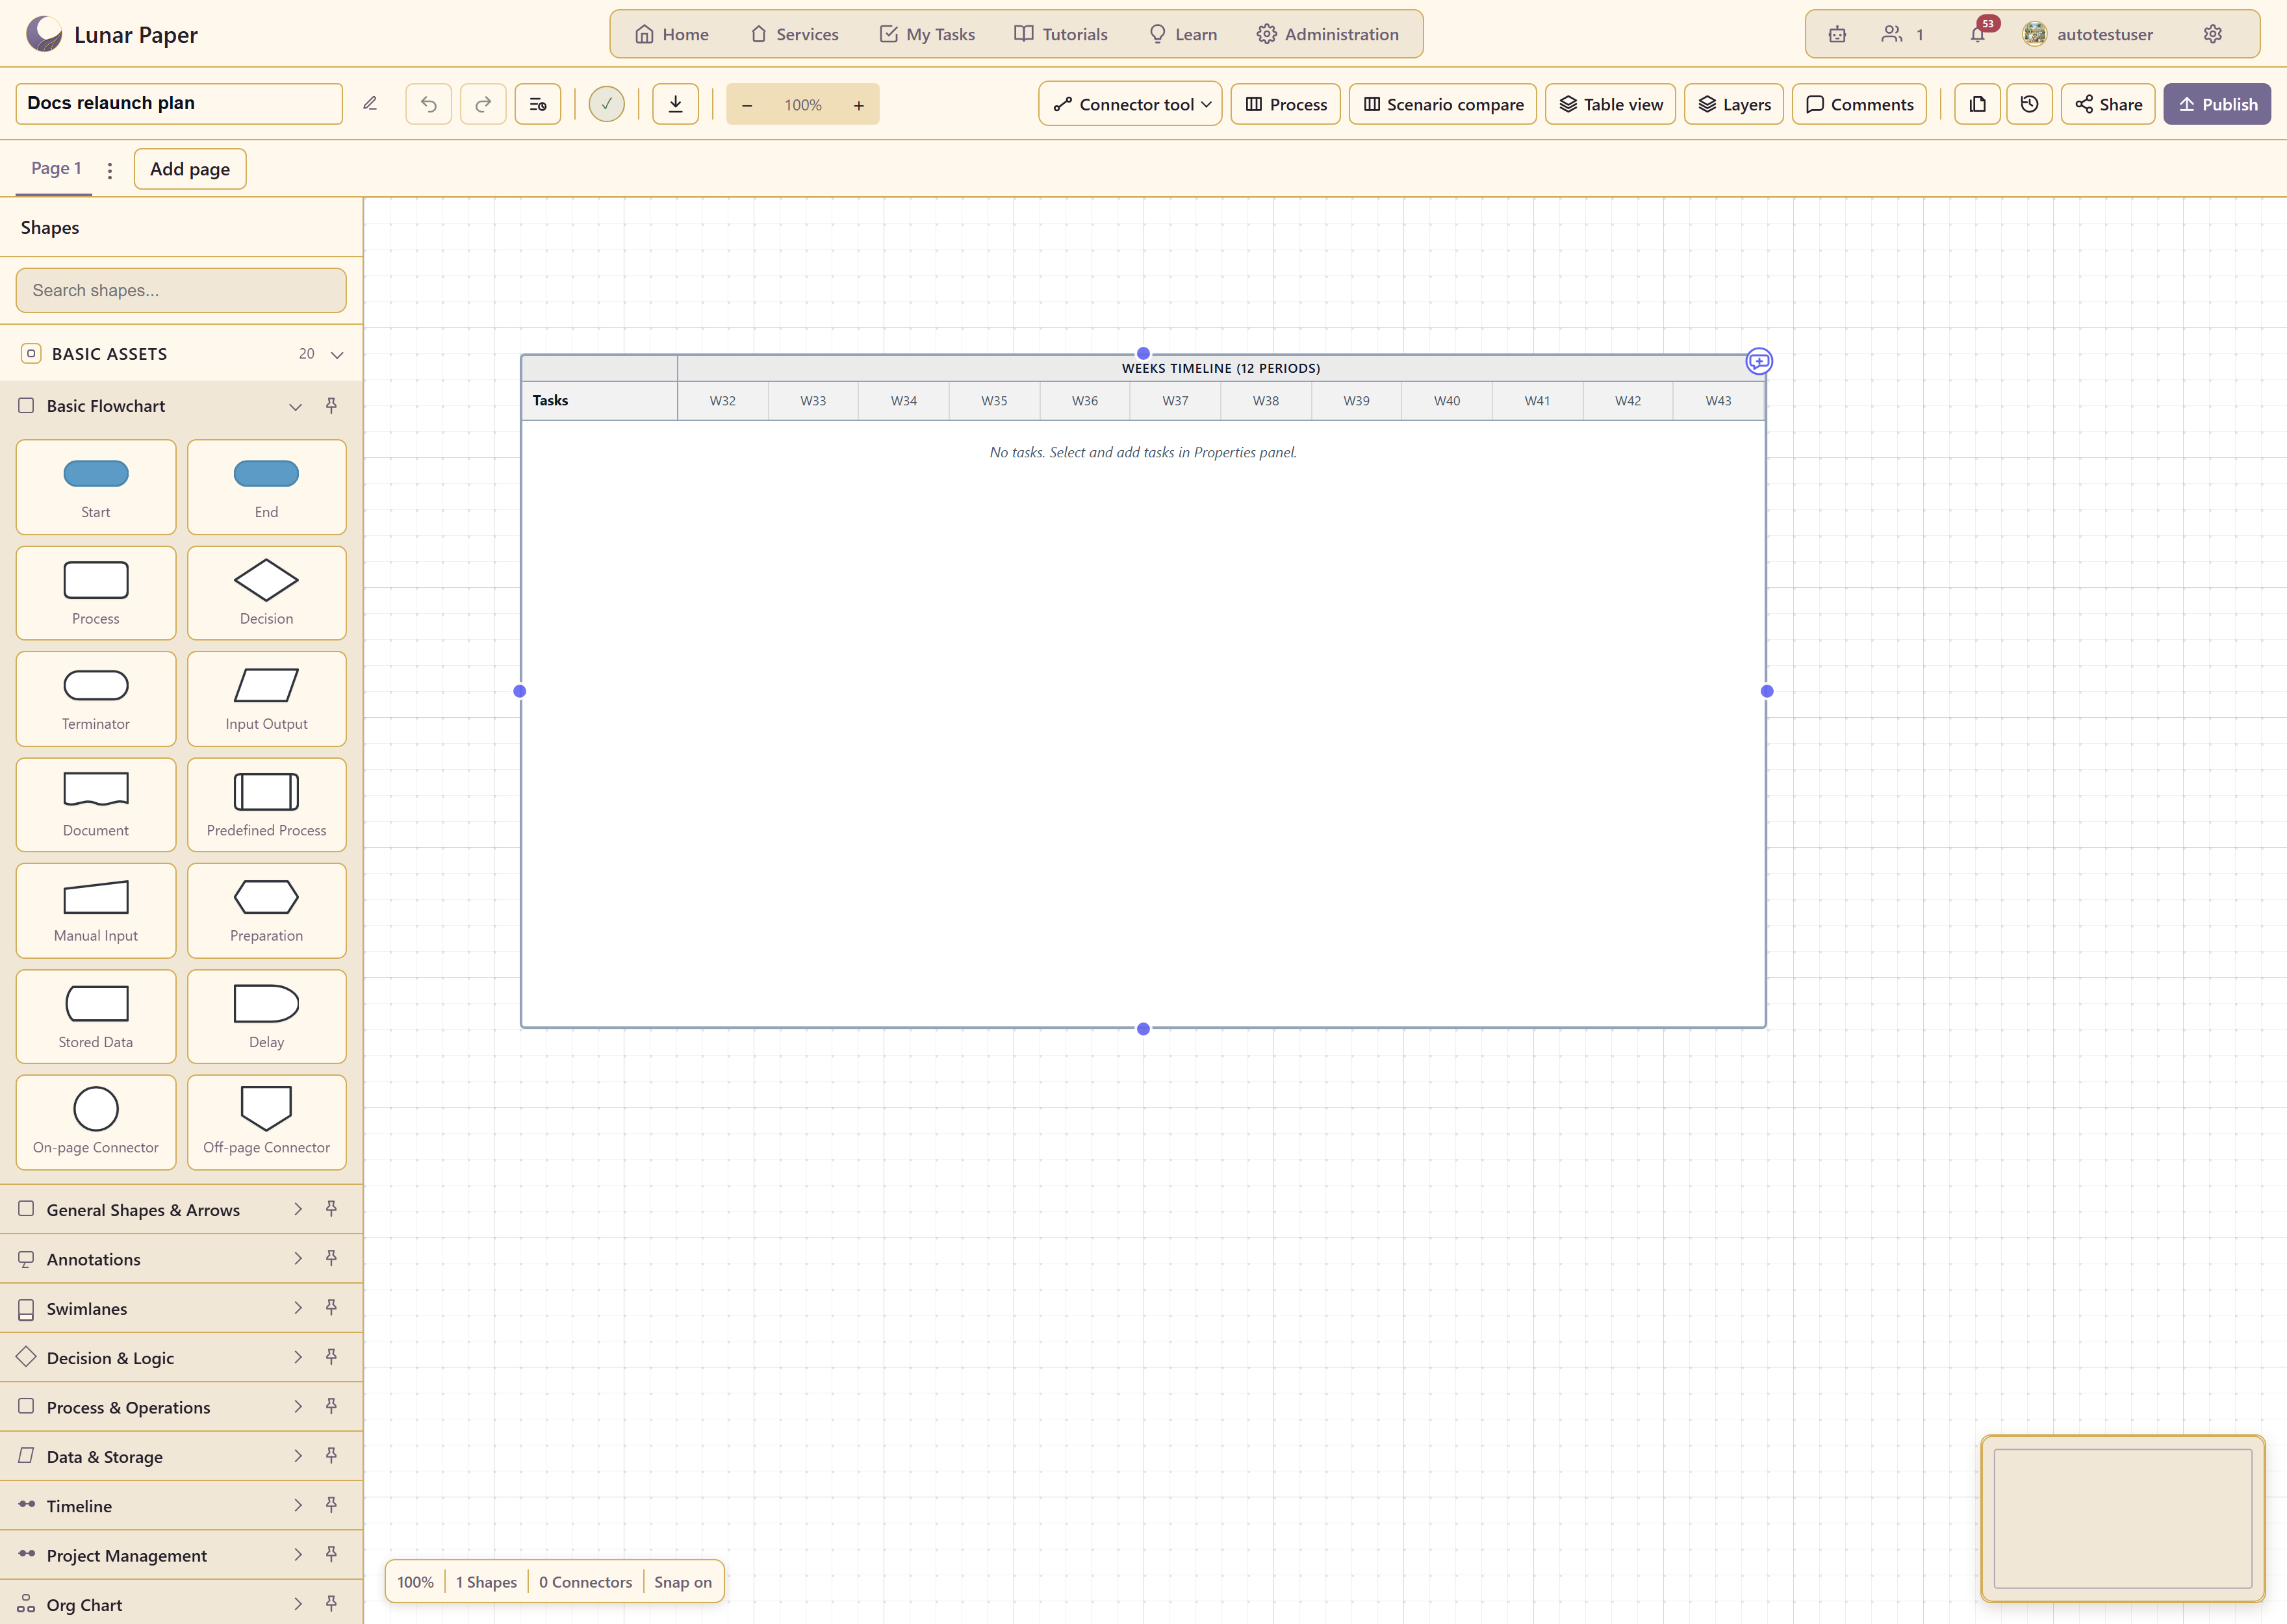
Gantt — work over time with milestones.
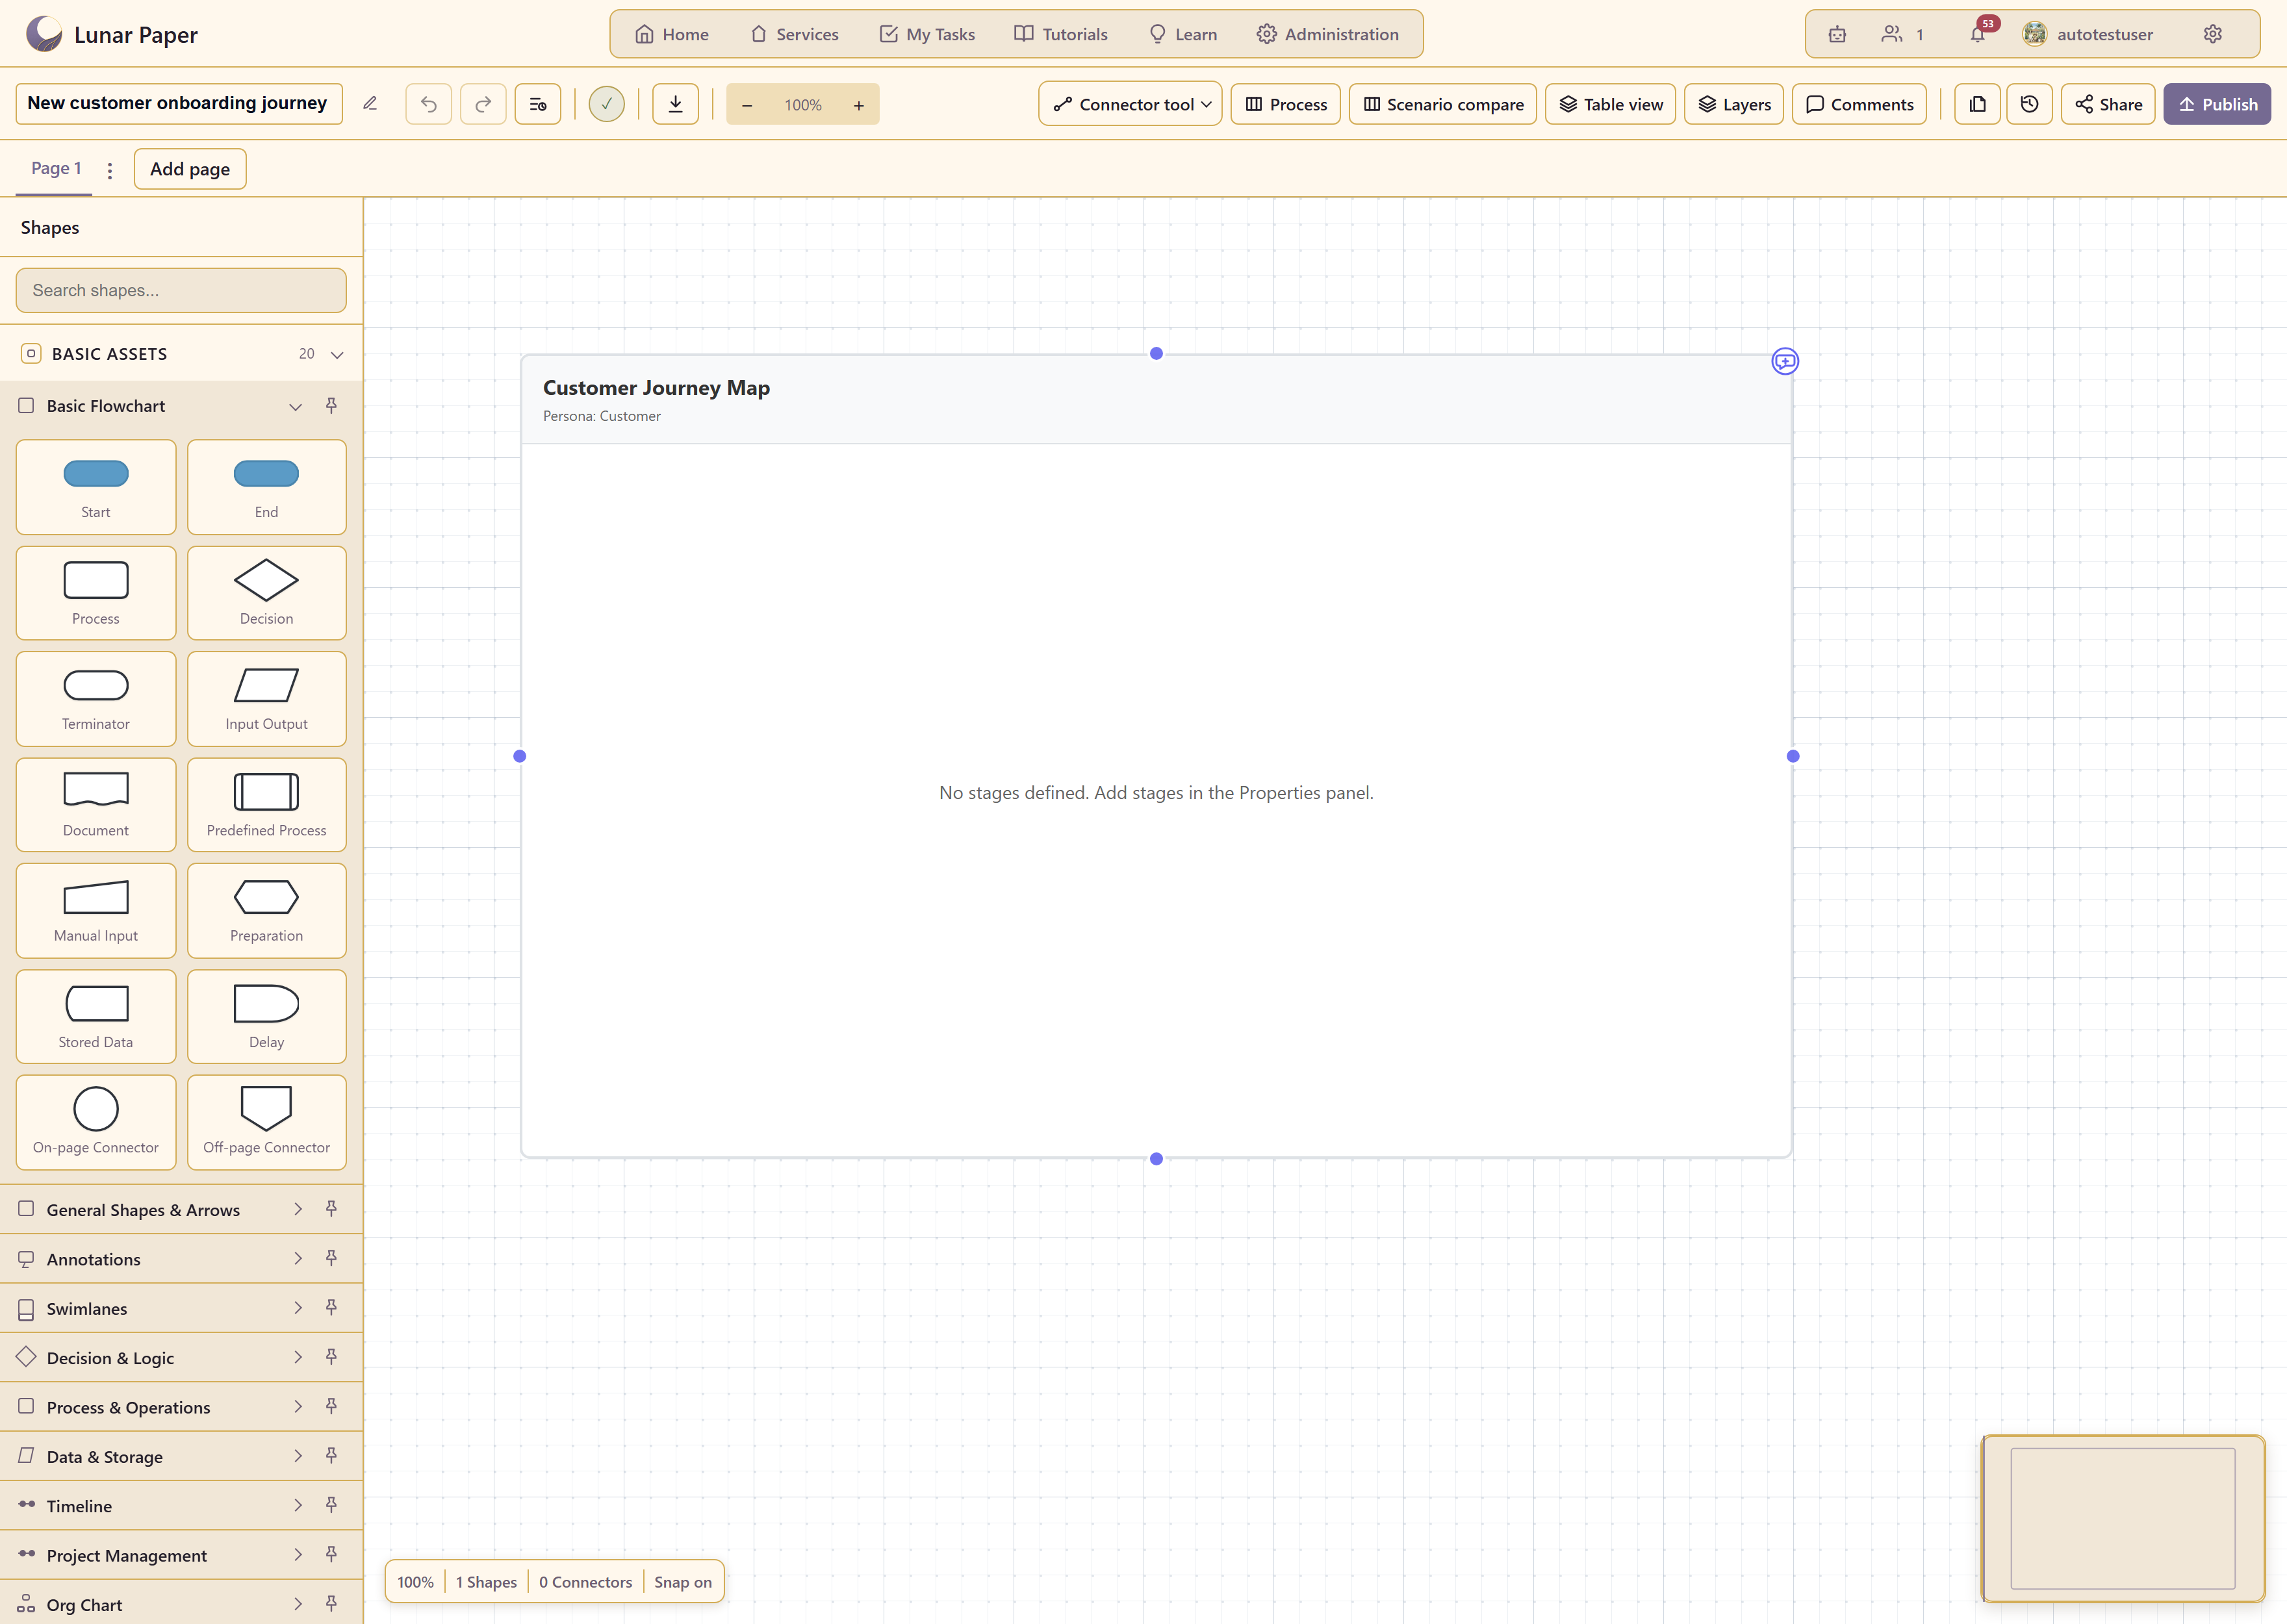
Journey Map — stages, emotions, and opportunities.
Choosing
Section titled “Choosing”For a process you want measured, take Process Map — it is the only template that arrives with the step data filled in.
For everything else, the templates are layout starting points. If none fits, Blank Canvas plus the shape libraries will get there, and it is not much slower.
A note on the analytics and finance templates
Section titled “A note on the analytics and finance templates”Sankey, Heatmap, Waterfall, and the rest are drawn diagrams, not charts generated from data. They give you the shape and you supply the numbers by editing the shapes.
If you want a chart that reads live data and updates on its own, that is Dashboards, not this module.
Related
Section titled “Related”Quickstart uses the Process Map template. Feature list covers what you can do once a chart exists.