
Annotate steps in the table
Annotating one step at a time on the canvas works for a handful of shapes. Past that, the table is faster and far more consistent, which matters because inconsistent data produces confident wrong numbers.
Open the table
Section titled “Open the table”Choose Table view in the toolbar. The canvas is replaced by one row per step, and the button changes to Canvas view to switch back.
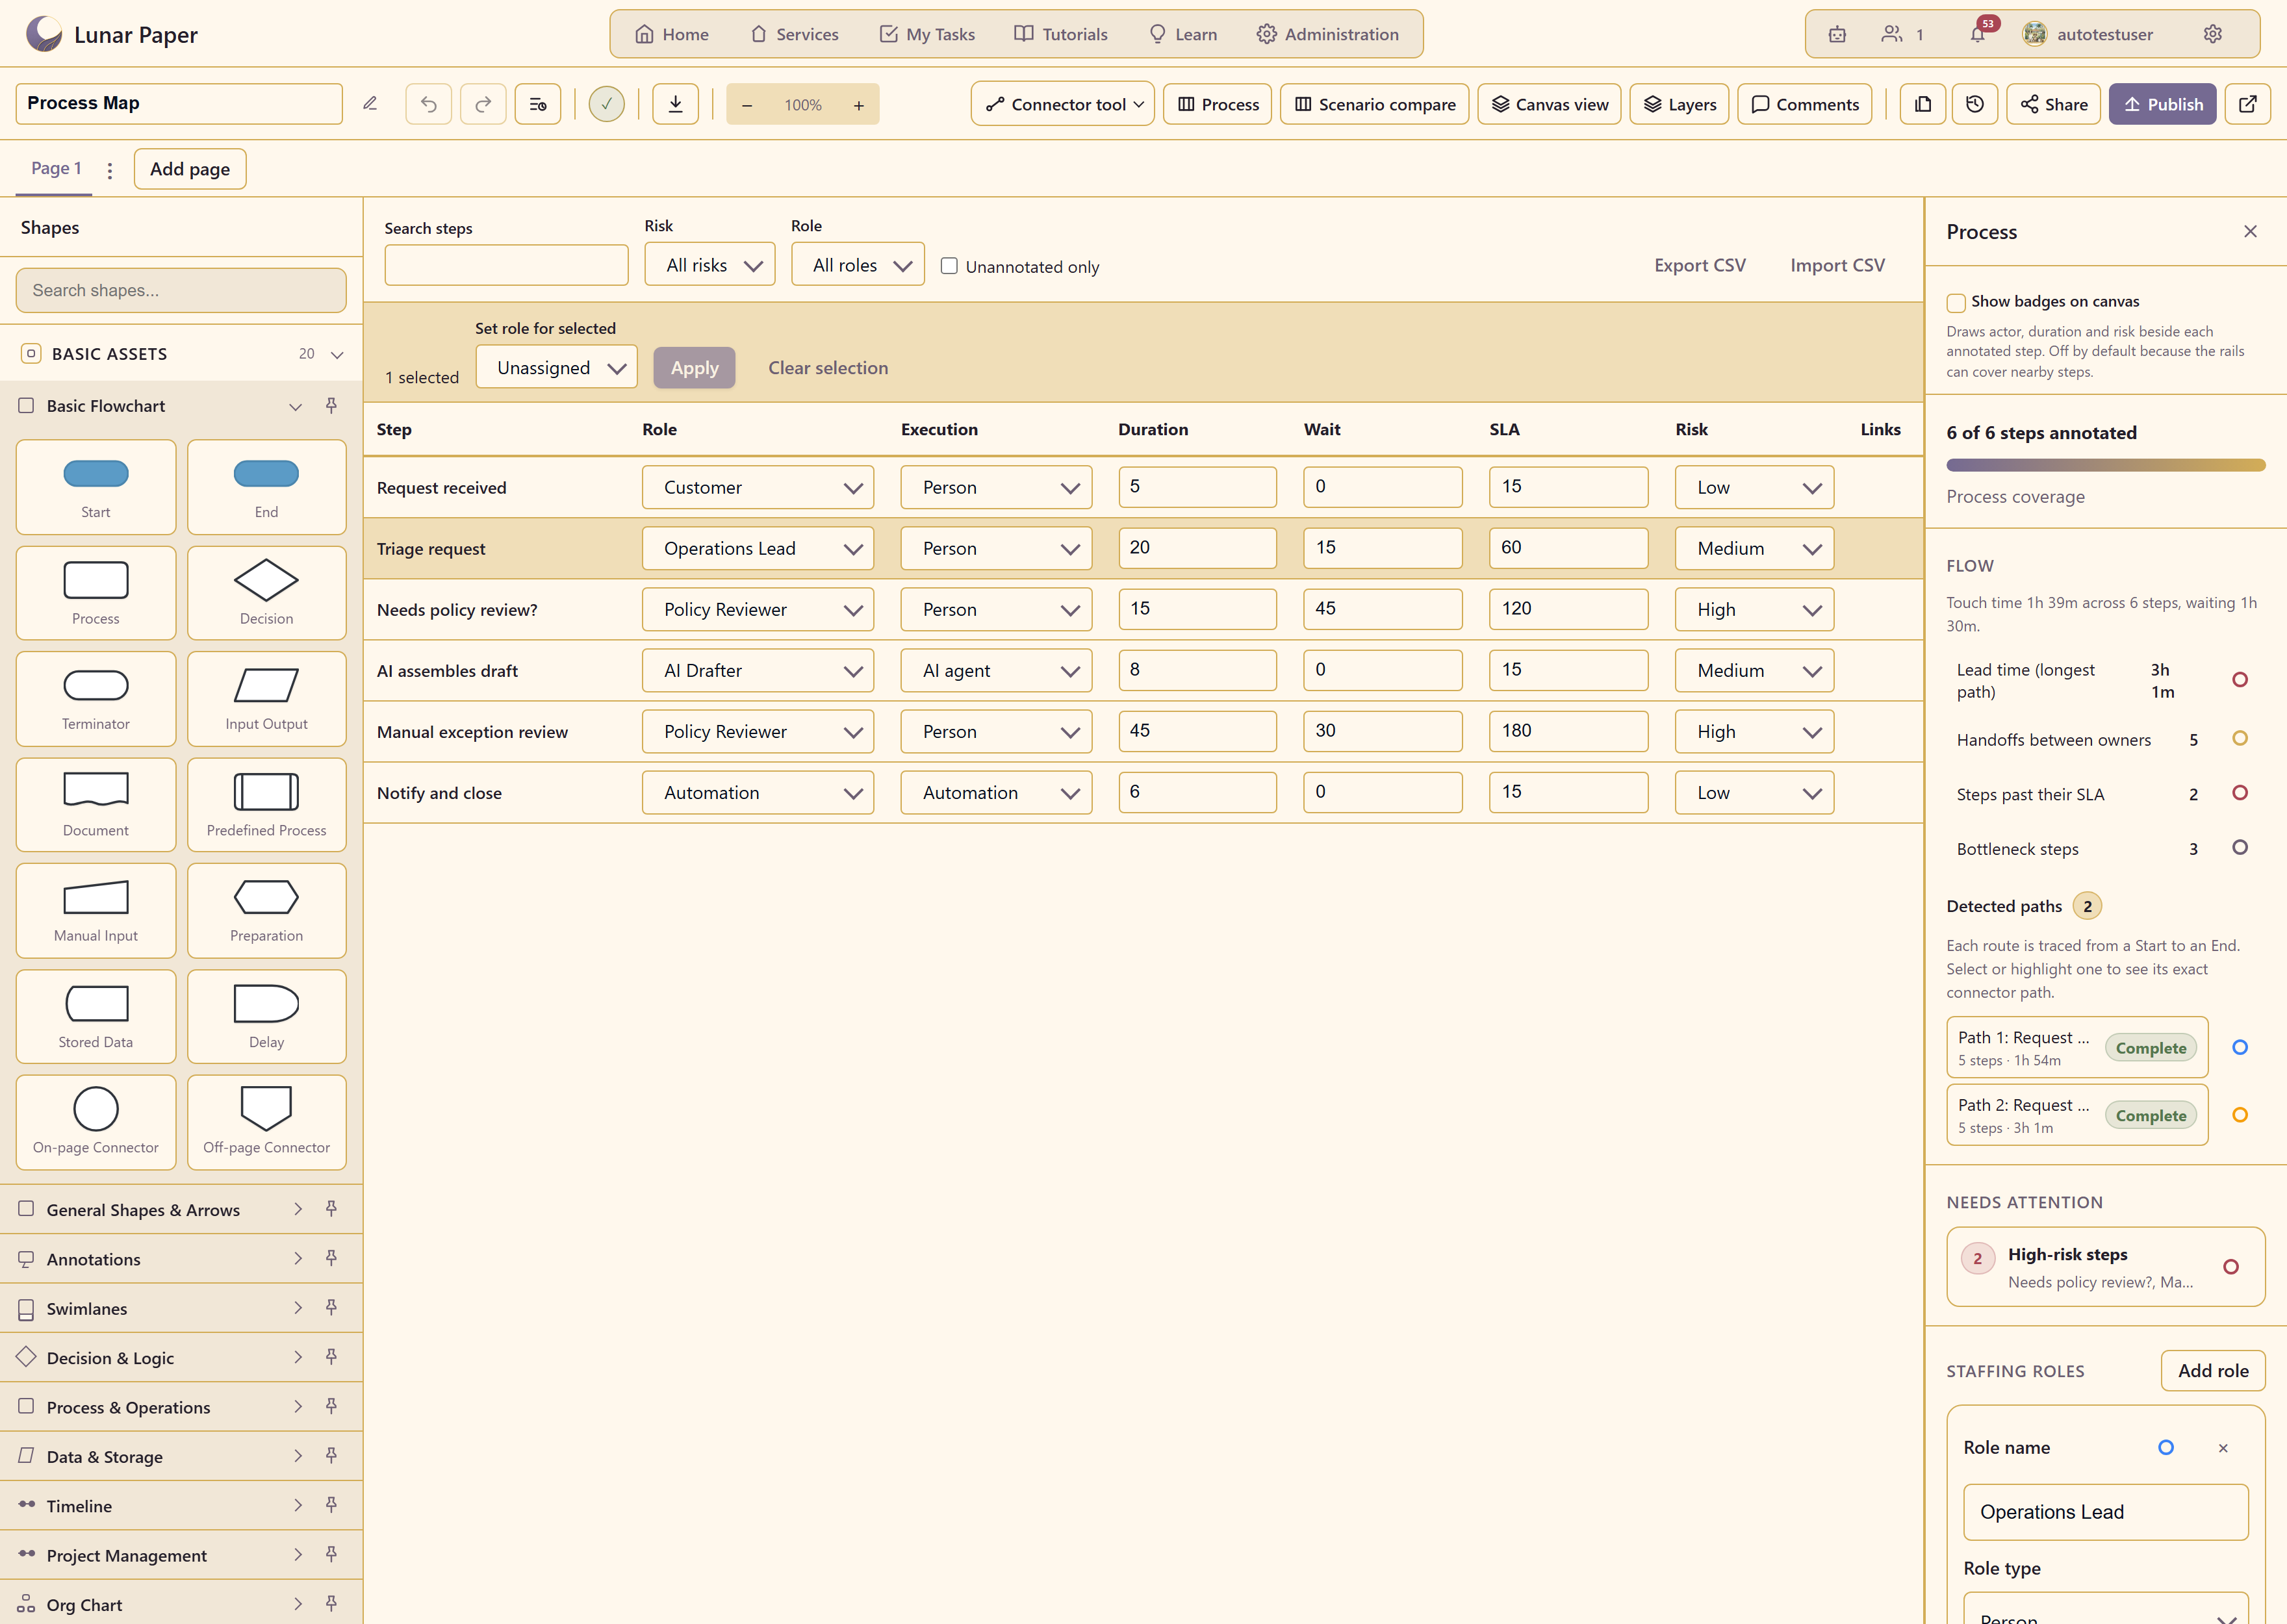
The Process panel stays open beside it, so you can watch the measures change as you type.
What each column means
Section titled “What each column means”Step is the shape’s label, and it is read-only here — rename steps on the canvas.
Role is who owns the work.
Execution is whether a person, an AI agent, or an automation does it.
Duration is hands-on time in minutes.
Wait is how long the step sits before anyone starts it.
SLA is how long the step is allowed to take, in the same units.
Risk is low, medium, or high.
Links attaches related material to the step.
Work down columns, not across rows
Section titled “Work down columns, not across rows”Set every role, then every execution type, then every duration. Going column by column keeps your judgement consistent, because you are comparing like with like.
Going row by row produces charts where the first three steps are carefully estimated and the last five are guesses, and nothing in the output tells you which is which.
Find the gaps
Section titled “Find the gaps”Unannotated only filters the table to steps still missing data. Use it as your finishing check — the Process panel’s coverage figure tells you a gap exists, and this tells you where.
Search steps filters by name, and the Risk and Role dropdowns narrow the table to one slice at a time. Filtering to a single role is the quickest way to sanity-check one person’s workload across a process.
Set many steps at once
Section titled “Set many steps at once”Select several rows and use Set role for selected, then Apply. Clear selection starts again.
This is the fastest way to correct a mistake you made consistently — assigning a whole phase to the wrong team, for example.
Take the data out and bring it back
Section titled “Take the data out and bring it back”Export CSV downloads the step table. Import CSV brings it back.
The round trip is worth knowing about for two jobs. Estimating with people who do not use Lunar Paper: send the CSV, let them fill in durations in a spreadsheet, import it. And bulk-editing beyond what the table supports: export, use find-and-replace or a formula, import.
Keep the step names untouched between export and import. They are what the two halves match on.
Sanity-check before you trust it
Section titled “Sanity-check before you trust it”Two numbers reveal most data-entry mistakes.
If touch time looks implausibly small, someone has entered hours as if they were minutes, or left durations at zero.
If lead time and touch time are nearly equal, the wait times are missing. Real processes wait; a chart that says otherwise has not been finished.
Related
Section titled “Related”Map a process end to end covers where these numbers come from and what to do with them. Feature list lists every measure the annotations feed.