
Report on progress
Most reporting questions are answered by the dashboard. The sections underneath exist for the ones it cannot answer: where the money is going against the plan, who is overloaded, and what to send a steering group.
Read the dashboard
Section titled “Read the dashboard”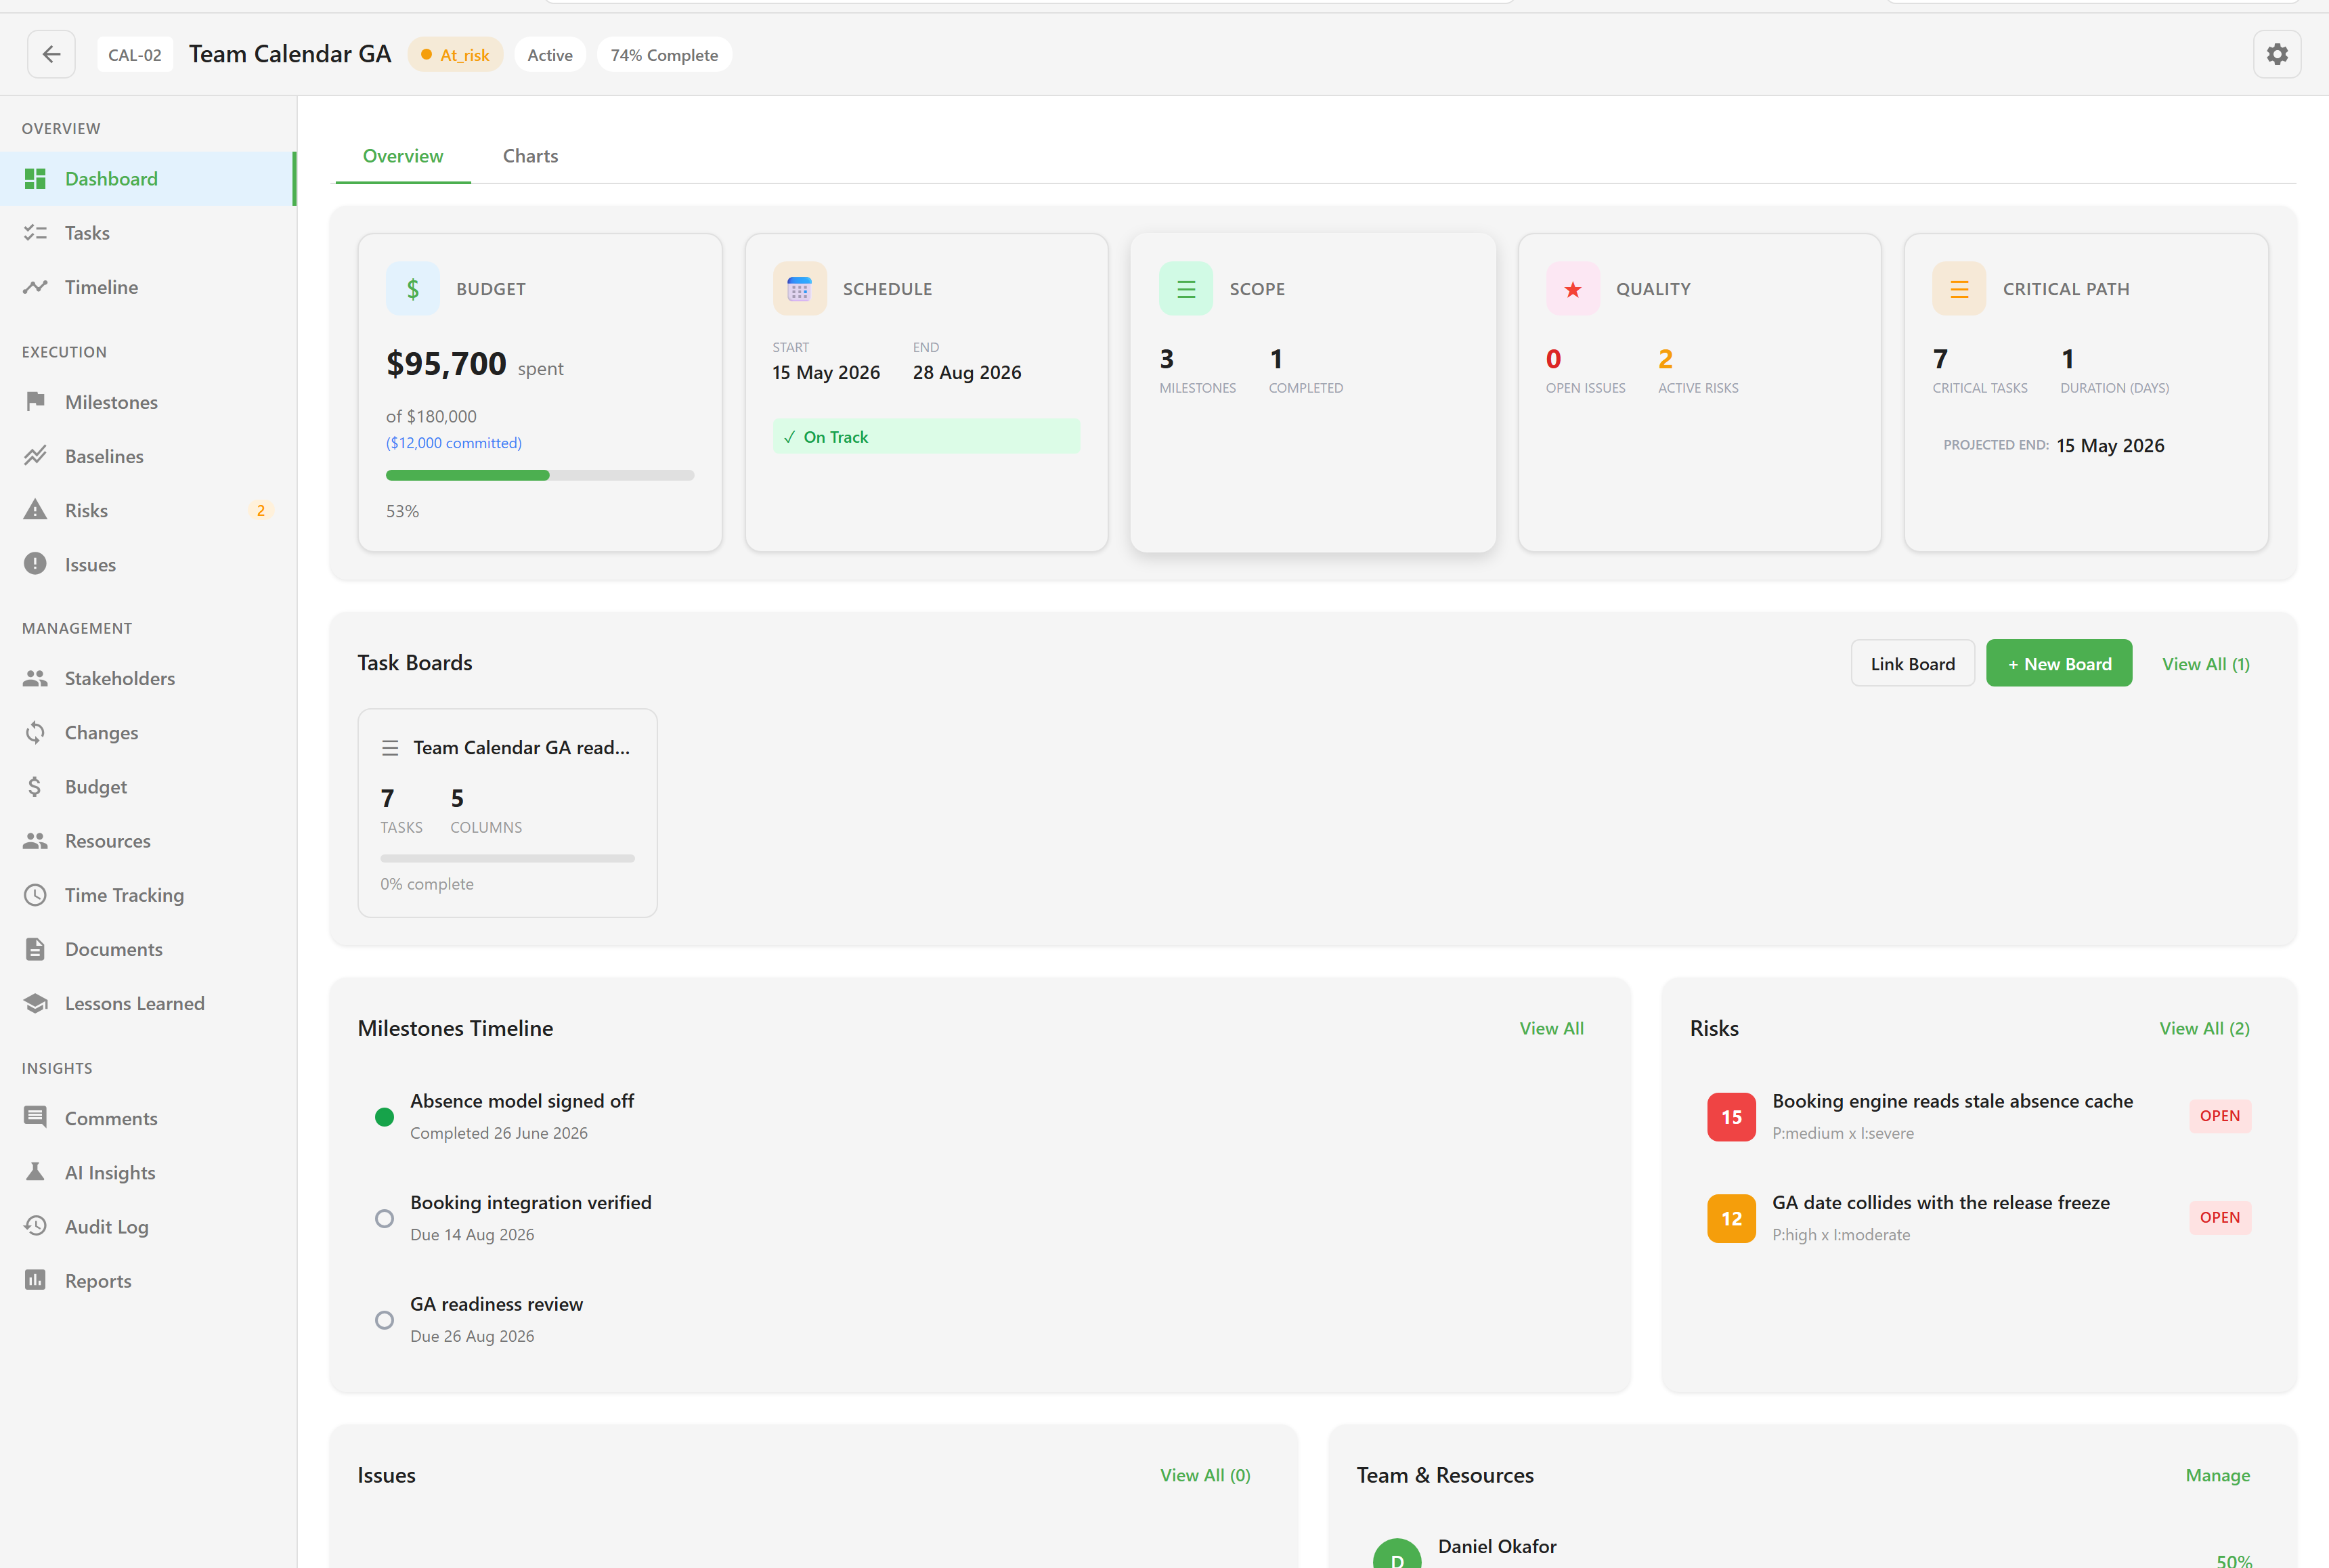
Four tiles carry the summary:
- Budget: spent against total, with a percentage.
- Schedule: the project’s dates, reported as On Track, At Risk, Behind Schedule, or Overdue.
- Scope: milestones defined and completed.
- Quality: open issues and active risks.
Below them sit the linked boards, the milestone timeline, and the risk and issue registers, each with a “View All” into the full section.
Two of these are only as good as their inputs. Budget reads the expense ledger, so a project where nobody records expenses shows zero spend on a healthy-looking bar. Progress comes from linked board tasks, so an unlinked project sits at 0% no matter how much work is done.
Generate a report
Section titled “Generate a report”Open Reports. Five kinds are offered: Status Reports, Risk Summary, Executive Brief, Meeting Agenda, and Task Summary. Generated reports are kept in the report history, so you can point at what was said at the time.
Scheduled Reports in Project Settings sends a report on a recurring basis rather than on demand.
Turn on the deeper sections
Section titled “Turn on the deeper sections”Three sections are switched off on every new project and have to be enabled in Project Settings → Features:
Earned Value reports planned value, earned value, actual cost, and the derived indices — cost and schedule performance, estimate at completion, and variance at completion. It needs estimated hours on tasks to mean anything.
Workload shows utilisation per person by week or month, calculated from remaining estimated hours on their assigned tasks. It uses a fixed assumption printed on the screen — 100% equals 40 hours a week — and does not read the capacity recorded against a resource. That makes it a different measure from the utilisation percentage in the resource pool; see Allocation and utilisation for how the two differ.
Dependencies draws the milestone dependency graph.
AI Insights
Section titled “AI Insights”AI Insights generates predictions, analysis, and narrative reports. It is disabled unless AI is enabled for the service, and the nav item explains why with “AI is not enabled for this service”.
What is not available
Section titled “What is not available”Project export does not currently work: the card, the table row, the bulk action, and the Import/Export dialog all fail with “Failed to export project”. Bulk archive, bulk status change, bulk assign, and the CSV import template are affected by the same problem. Until it is fixed, take what you need from the report pack instead.
For the full list of sections, see the project views reference.