
Explore and export data
Selecting an exposed table opens the explorer, which is the fastest way to answer “what is actually in here?” without leaving the platform.
Read the summary first
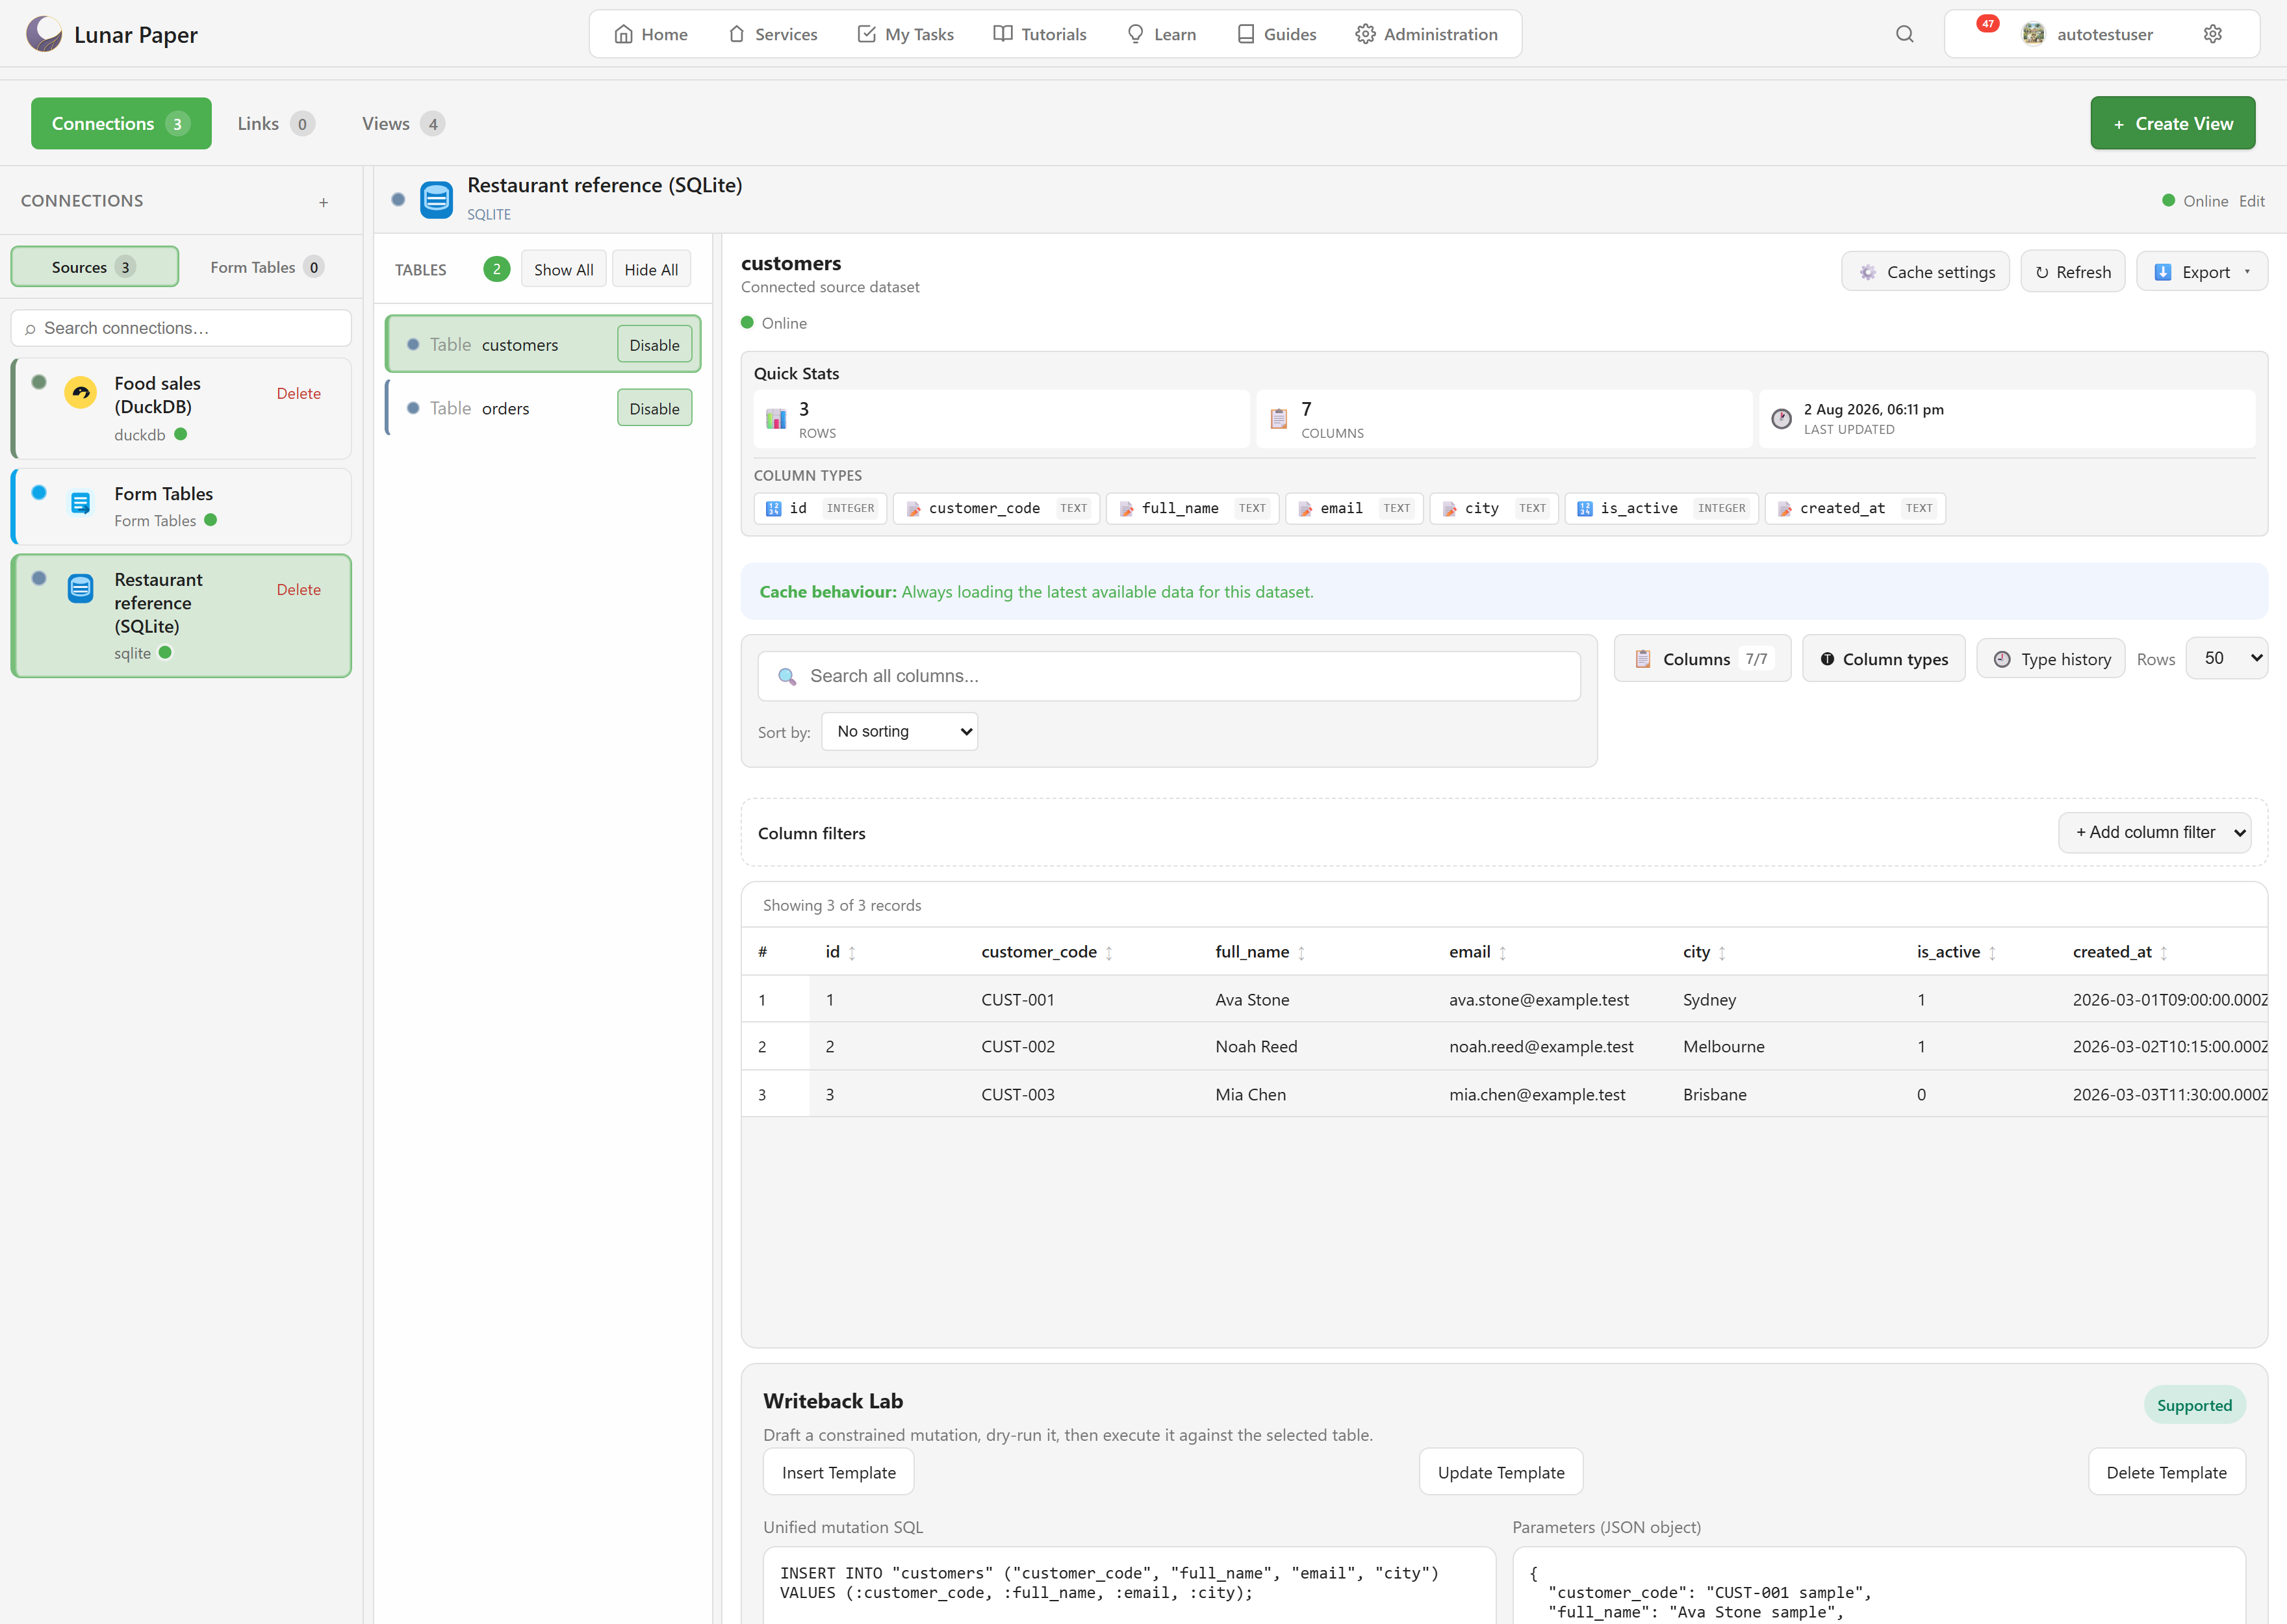
Section titled “Read the summary first”Quick Stats gives the row count, the column count, and when the data was last read.
Column Types lists every column with its type. This is worth a look before you build anything on the table, because types decide what a chart can do with a column — a date stored as text will not group by month.
Underneath, a line states the cache behaviour in plain terms, so you know whether you are looking at live data or something cached.
Narrow the rows
Section titled “Narrow the rows”Search all columns filters across everything.
Column filters are more precise: + Add column filter builds a condition on one column at a time, and they combine.
Sort by orders the results, and the column headers sort too.
Rows sets the page size — 25, 50, 100, or 250. It changes what is fetched, so leaving it at 250 on a large table is slower than leaving it at 25.
The count above the grid tells you what you are looking at: “Showing 3 of 3 records” means everything, and a smaller first number means the filters are doing something.
Refresh and export
Section titled “Refresh and export”Refresh re-reads the table, ignoring anything cached.
Export downloads what you are currently looking at, filters included. So filter first, then export — it is the difference between the rows you wanted and the whole table.
Cache settings
Section titled “Cache settings”Cache settings controls how fresh this dataset needs to be. Control caching covers the options and the trade-off.
The Writeback Lab
Section titled “The Writeback Lab”At the bottom of the explorer is the Writeback Lab, for changing data rather than reading it.
It carries a badge saying whether writeback is Supported for this connector. Not every source allows it, and the ones that do not say so rather than failing quietly.
Insert Template, Update Template, and Delete Template generate a starting statement for the selected table. You get a Unified mutation SQL box with named parameters and a Parameters box holding a JSON object of values.
The intended sequence is written on the panel: draft a constrained mutation, dry-run it, then execute it.
Take that literally. This writes to the real database — the same one your applications are using. The dry run exists so you can confirm what a statement will touch before it touches it, and the parameters are named rather than inlined so a value cannot change the shape of the statement.
If you are not sure what a statement will do, do not run it here. Data Hub is a window onto a production database, and it does not have an undo.
Build a view turns a shape you have found here into something reusable.