
Improve a process with scenarios
A scenario pins the chart as it stands and gives you a copy to change. You then compare the two, which turns “this would be faster” into a number somebody can approve.
This assumes you already have a mapped, annotated process. If not, map a process end to end first — the comparison is meaningless without a baseline you trust.
1. Make sure the baseline is honest
Section titled “1. Make sure the baseline is honest”Before creating a scenario, check the current chart one more time.
Open the Process panel and confirm coverage is complete. Any unannotated step is one the comparison will not count, which quietly flatters whichever version has more gaps.
Check the wait times especially. A baseline that understates waiting will make almost any change look marginal, because waiting is usually what a change removes.
2. Create the scenario
Section titled “2. Create the scenario”Choose Scenario compare in the toolbar, then Create scenario.
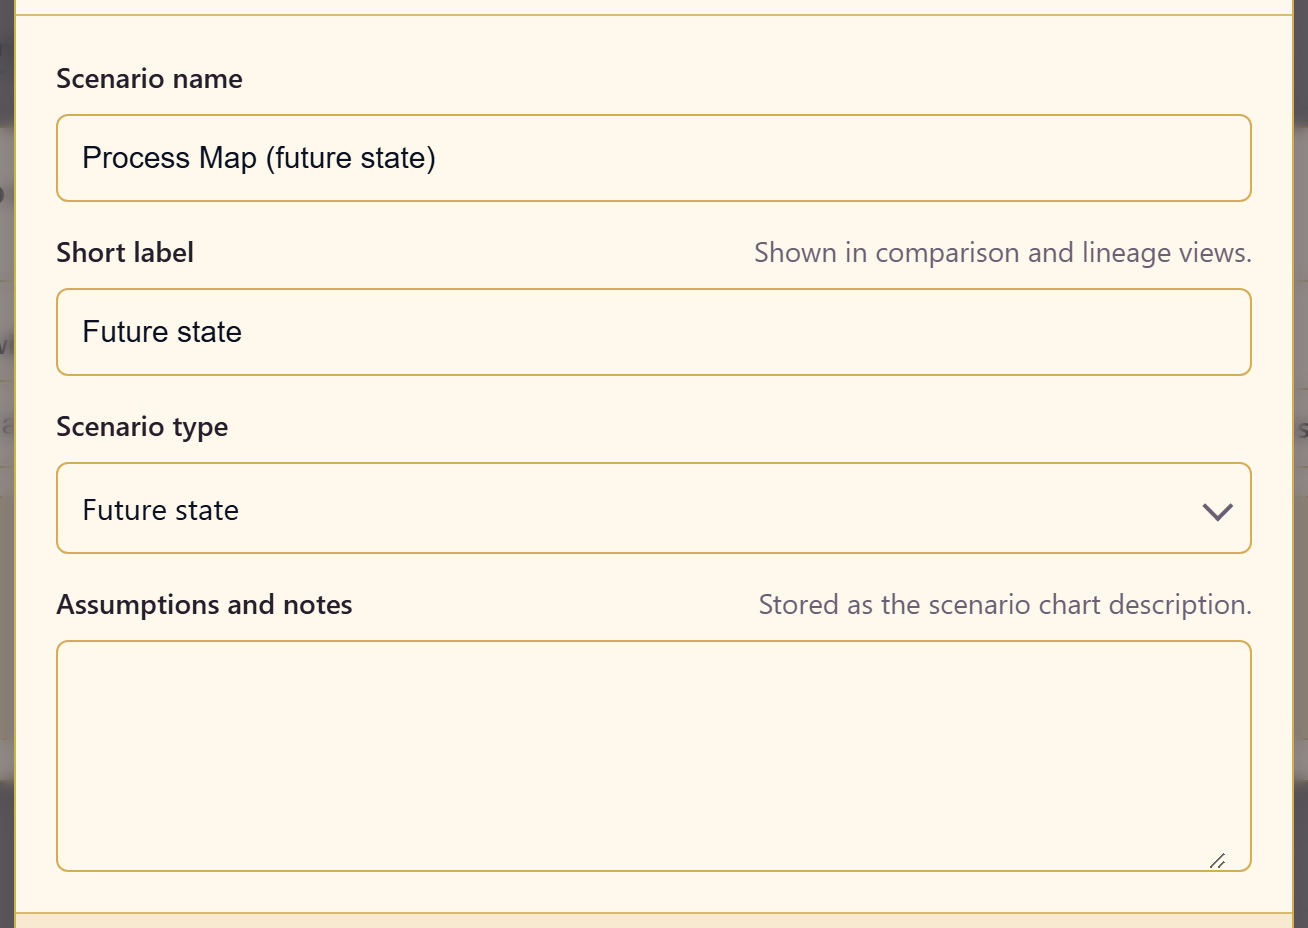
Scenario name is a short label that appears in comparison views. Name it after the change, not the date — “Auto-triage low-risk requests” rather than “August version”.
Scenario type says what the scenario represents, for example a future state.
Assumptions and notes is where the reasoning goes, and it is the field people skip and later regret. Write down what you are assuming: that the AI classifier is accurate enough, that the second reviewer is no longer needed, that volume stays flat. When someone questions the numbers in three months, this is the answer.
3. Draft the change
Section titled “3. Draft the change”The scenario opens as its own chart. Change it to reflect the proposal.
Typical changes and where they show up:
Removing a handoff — delete a step or change its role so two consecutive steps share an owner. Watch the handoff count.
Automating a step — change its Execution from person to automation or AI agent, and cut its duration and wait accordingly. Be realistic: automation rarely takes zero time and often adds a new failure path.
Removing a wait — reduce the Wait figure. This is usually the biggest single win and the one people forget to model, because it does not change the picture at all.
Adding a branch — an automated route usually needs an exception path for the cases it cannot handle. Draw it. A proposal that assumes nothing ever falls through will not survive contact with the first month.
4. Compare
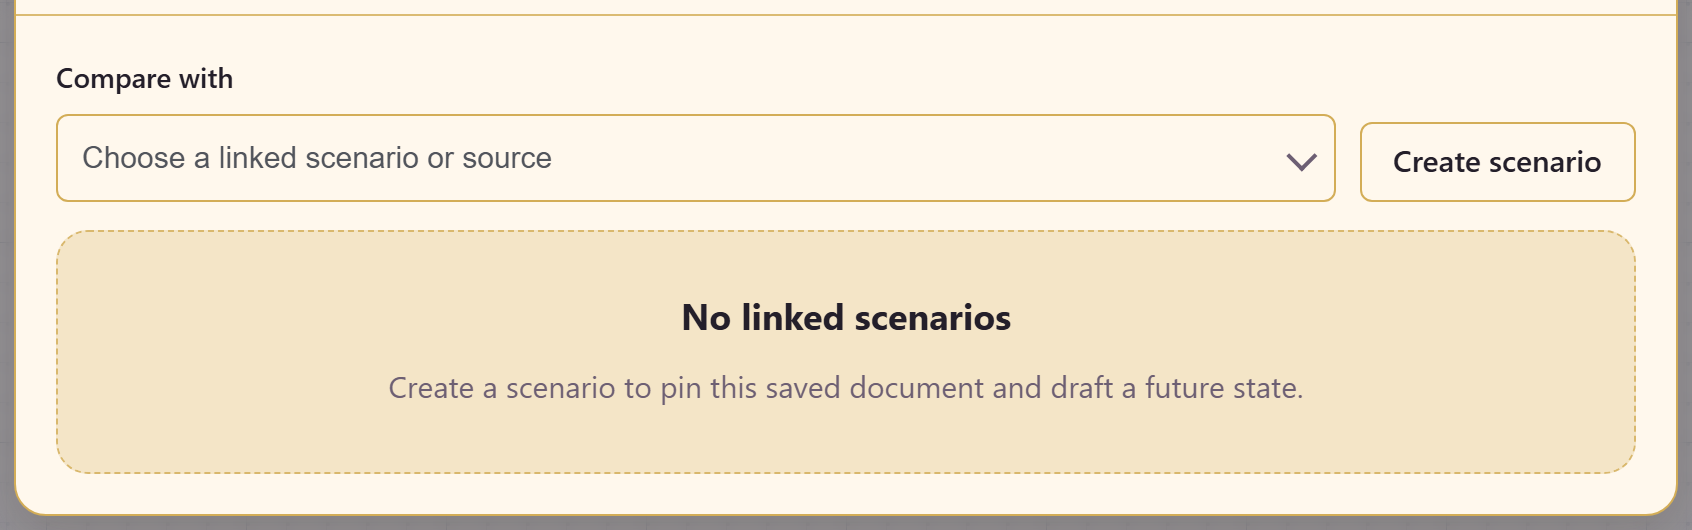
Section titled “4. Compare”Open Scenario compare and choose the scenario in Compare with.
Read the same measures you read on the baseline: lead time, touch time, handoffs, steps past SLA, bottlenecks.
The comparison worth quoting is usually lead time, because it is what anyone waiting on the process actually experiences. Touch time matters for cost; lead time matters for the customer.
5. Check what the change breaks
Section titled “5. Check what the change breaks”Before taking it anywhere, look at what got worse.
Did the risk profile shift? Automating a step often moves risk rather than removing it — the work is faster and the failure is now silent. If the scenario has a high-risk step the baseline did not, say so.
Did a path disappear? Check Detected paths on both. A route that vanished either was genuinely unnecessary or is an exception case somebody still needs.
6. Present the two together
Section titled “6. Present the two together”Publish the scenario alongside the baseline, and put both links in whatever document makes the case.
The argument that lands is the specific one: “today this takes 3h 1m end to end with five handoffs; with auto-triage it is 1h 20m with two.” Two published charts and the numbers underneath them are more convincing than a slide claiming an improvement.
Keep the assumptions visible. A proposal whose reasoning is written down survives a change of audience; one that only exists in the presenter’s head does not.
7. After the change is made
Section titled “7. After the change is made”If the change goes ahead, remap the real process once it has settled and publish that as the new baseline.
The scenario stays as a record of what was proposed, which is useful when someone later asks whether the change delivered what it promised.
Related
Section titled “Related”Charts and processes explains what the module can and cannot measure. Map a process end to end covers building the baseline this guide depends on.