
How data reaches a widget
A number on a dashboard has travelled through four stages. Knowing what they are means “the chart is empty” has four possible causes you can check in order.
The chain
Section titled “The chain”1. A connection. Data Hub holds the credentials and the address of the database or file. Dashboards never opens a source directly and has no connection settings of its own.
2. Managed datasets. When a connection is created, Data Hub scans it and registers each table it finds as a managed dataset. You do not create these; they appear. In the Data panel they are tagged DATASET.
3. Data views, optionally. A view is a saved query over the connection — a rollup, a filter, a join. You build these in Data Hub. In the Data panel they are tagged VIEW. A dataset gives you the raw table; a view gives you the summarised or filtered version you want to chart.
4. A binding. Dragging a column from the Data panel onto a widget records which column feeds which part of that widget. Until a widget has a binding it shows as an empty frame.
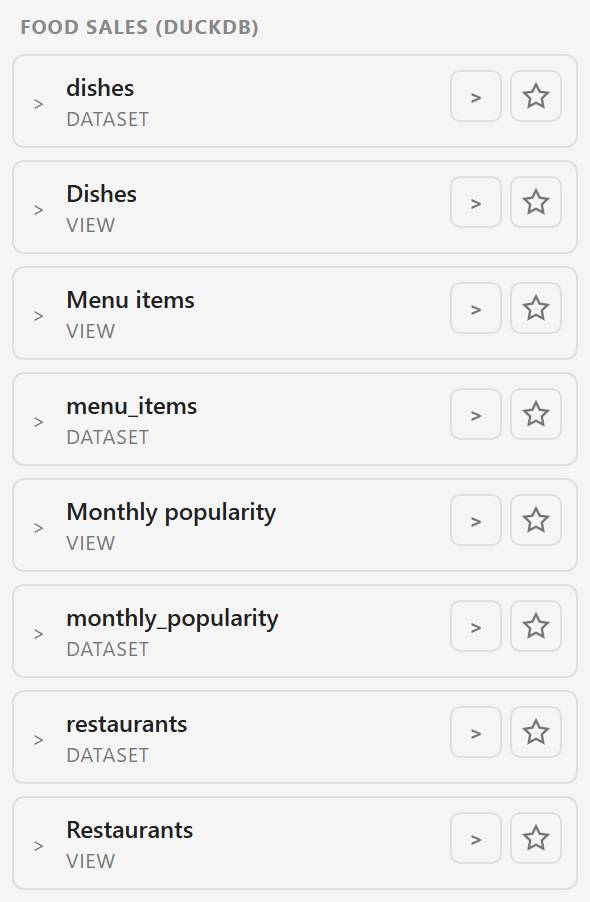
Both datasets and views are bindable, and the Data panel groups them together under the name of the connection they came from. Nothing else is bindable — a dashboard cannot read a form’s submissions, a task board, or a file in Assets.
What a binding actually stores
Section titled “What a binding actually stores”A binding is a list of column mappings. Each mapping names a column and the role it plays: the x axis, the y axis, the value. Numeric mappings also carry an aggregation — sum, average, and so on — which decides how rows are combined into a single point.
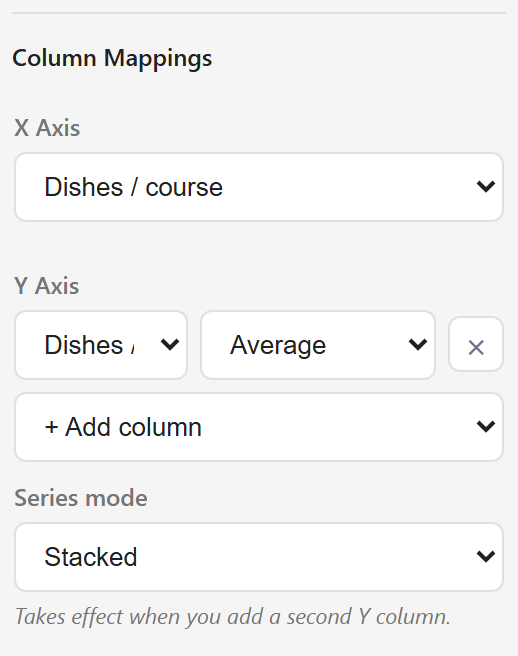
The aggregation matters more than it looks. A KPI card bound to a ratings column with Sum shows a meaningless total; the same card with Average shows the rating. Neither is an error, and nothing warns you, so check it whenever you bind a number.
Dragging is the only way to create a binding
Section titled “Dragging is the only way to create a binding”The properties panel edits bindings that already exist. It cannot make one from nothing — there is no “choose a column” dropdown on an unbound widget. If a widget shows no data and its properties panel offers no column mappings, it has never been bound, and the fix is to drag a column onto it.
This catches people out most often on widgets copied from elsewhere or created outside the designer.
The data is fetched once
Section titled “The data is fetched once”A widget loads its data when the page loads and then keeps it. Nothing on a dashboard refreshes on a timer, in the designer or the published view. A published dashboard shows the data as it was when the reader opened the page, and they have to reload to see anything newer.
There is a fifteen-second timer in the published view, but it reports viewing activity for the Analytics tab. It does not fetch data again.
Where it breaks
Section titled “Where it breaks”If the Data panel is empty, the problem is at stage 1 or 2: either no connection exists in this service, or the connection has not finished its scan.
If a widget shows nothing, it is almost always stage 4. The widget has no binding.
If a widget shows a number that is wrong rather than missing, that is stage 4 as well, and usually the aggregation.
If a table shows a Partial data badge, the query returned more rows than the widget will draw, and you are seeing the first page of them.
Related
Section titled “Related”Add and bind widgets is the practical version of this page. Troubleshooting works through the failures above in order.