
Designer reference
The designer opens when you create a chart or choose Open on a chart card.
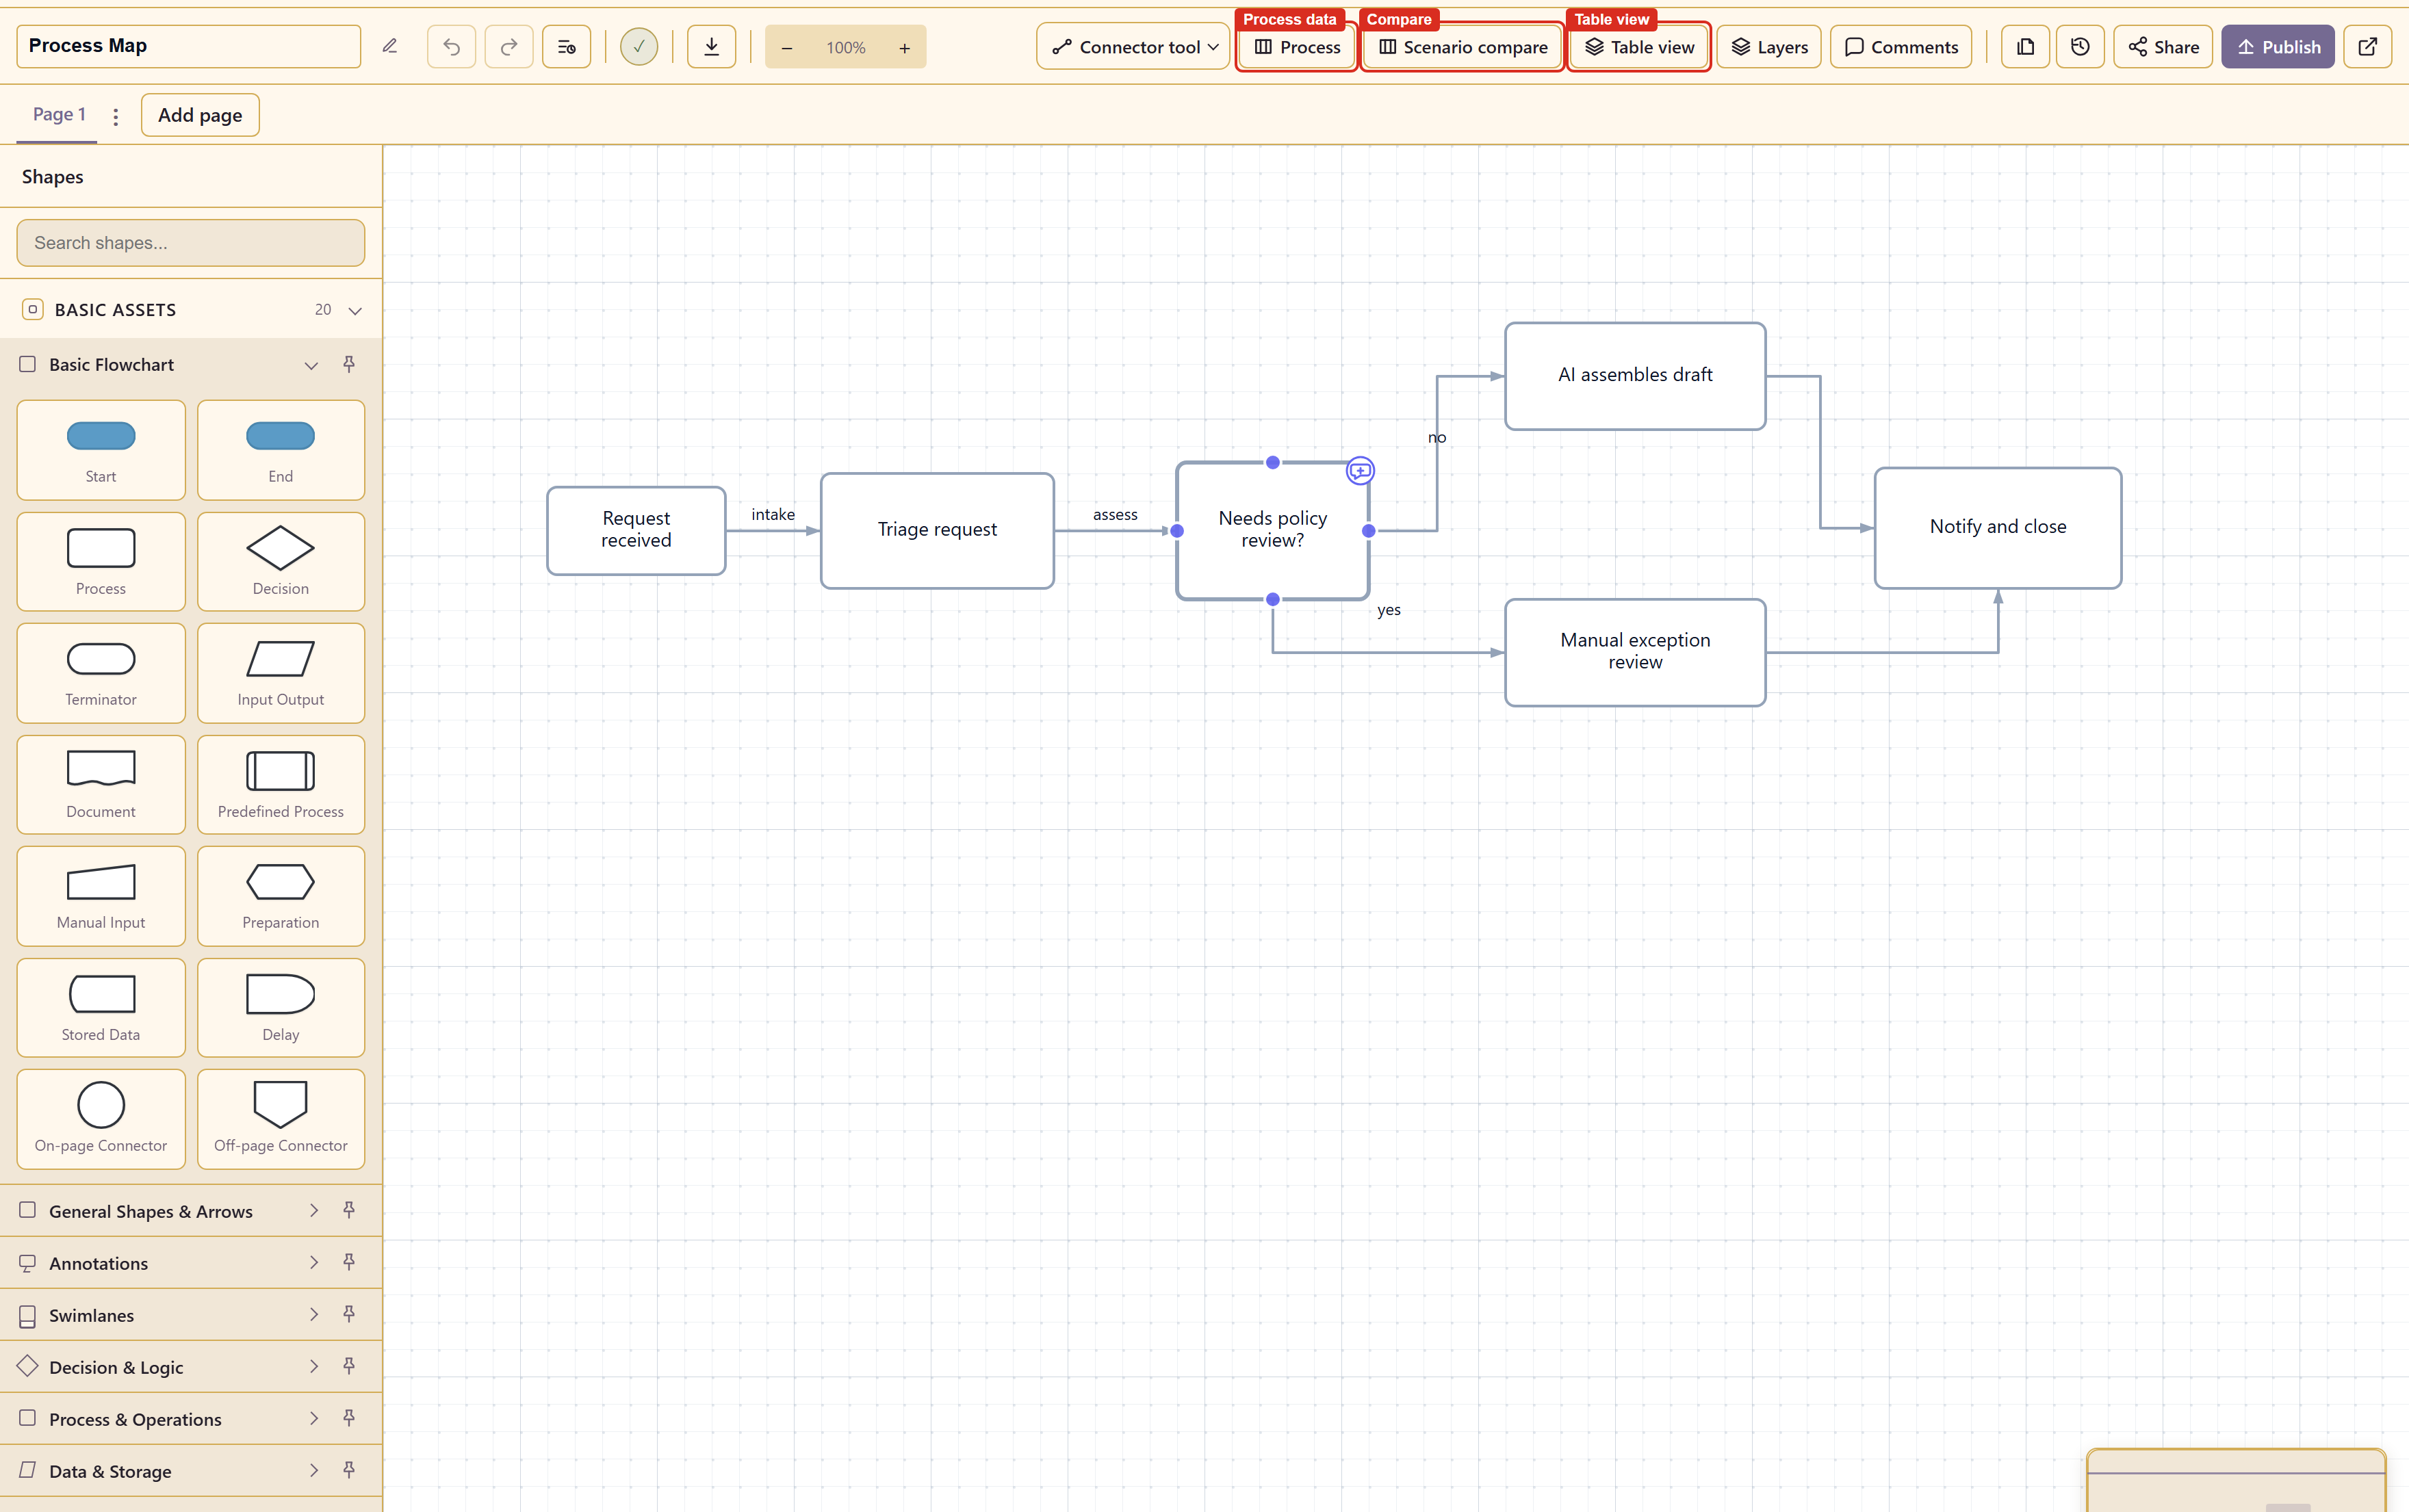
Toolbar — left
Section titled “Toolbar — left”| Control | What it does |
|---|---|
| Chart name | Editable in place. Renames the chart |
| Undo / Redo | Steps through changes |
| Validate | Checks the chart for structural problems |
| Export | PNG, SVG, or PDF, with resolution and content options |
| Zoom out / percentage / zoom in | Changes what you see, not what is stored |
Toolbar — tools and panels
Section titled “Toolbar — tools and panels”| Control | What it opens |
|---|---|
| Connector tool | Draws connections, with a choice of line styles |
| Process | The process panel — coverage, flow measures, detected paths, staffing roles |
| Scenario compare | Compares the chart against a linked scenario, or creates one |
| Table view | Every step as an editable row. Becomes Canvas view to switch back |
| Layers | Show and hide groups of shapes |
| Comments | Comments on the chart and on individual shapes |
| Version history | Previous saved versions |
Toolbar — sharing
Section titled “Toolbar — sharing”| Control | What it does |
|---|---|
| Share | Gives other people access to the chart |
| Publish | Publishes a read-only copy for the service |
| Open published | Opens the published version, once one exists |
Page bar
Section titled “Page bar”| Control | What it does |
|---|---|
| Page tabs | Switch between the chart’s pages |
| Page menu | Options for the current page |
| Add page | Creates another page |
Shape panel
Section titled “Shape panel”| Control | What it does |
|---|---|
| Search shapes | Searches every category at once |
| Category headers | Expand and collapse a category |
| Pin | Keeps a category at the top of the list |
Twenty categories are listed. Connectors are the exception — they are drawn with the Connector tool rather than dragged from here. Shape libraries lists all 353 shapes.
Status bar
Section titled “Status bar”Along the bottom of the canvas: the zoom level, the number of shapes, the number of connectors, and whether snapping is on.
Minimap
Section titled “Minimap”Bottom right. Shows the whole canvas with your current view marked, which is how you find your way around a chart bigger than the screen.
Process panel
Section titled “Process panel”Opened with Process.
Show badges on canvas draws the actor, duration, and risk beside each annotated step. Off by default, because the badges can cover nearby shapes.
Process coverage — how many steps are annotated out of the total.
Flow — touch time, waiting time, lead time along the longest path, handoffs between owners, steps past their SLA, and bottleneck steps.
Detected paths — every route from a Start to an End, each with a step count and a total time.
Needs attention — high-risk steps.
Staffing roles — the roles used in the chart, each with a role type, and Add role.
Table view
Section titled “Table view”| Control | What it does |
|---|---|
| Search steps | Filters rows by step name |
| Risk / Role | Filters rows to one risk level or owner |
| Unannotated only | Shows just the steps missing data |
| Export CSV / Import CSV | Takes the step table out and brings it back |
| Set role for selected | Assigns a role to several steps at once |
Columns are Step, Role, Execution, Duration, Wait, SLA, Risk, and Links.
Related
Section titled “Related”Draw a diagram from scratch and Annotate steps in the table cover these in use.