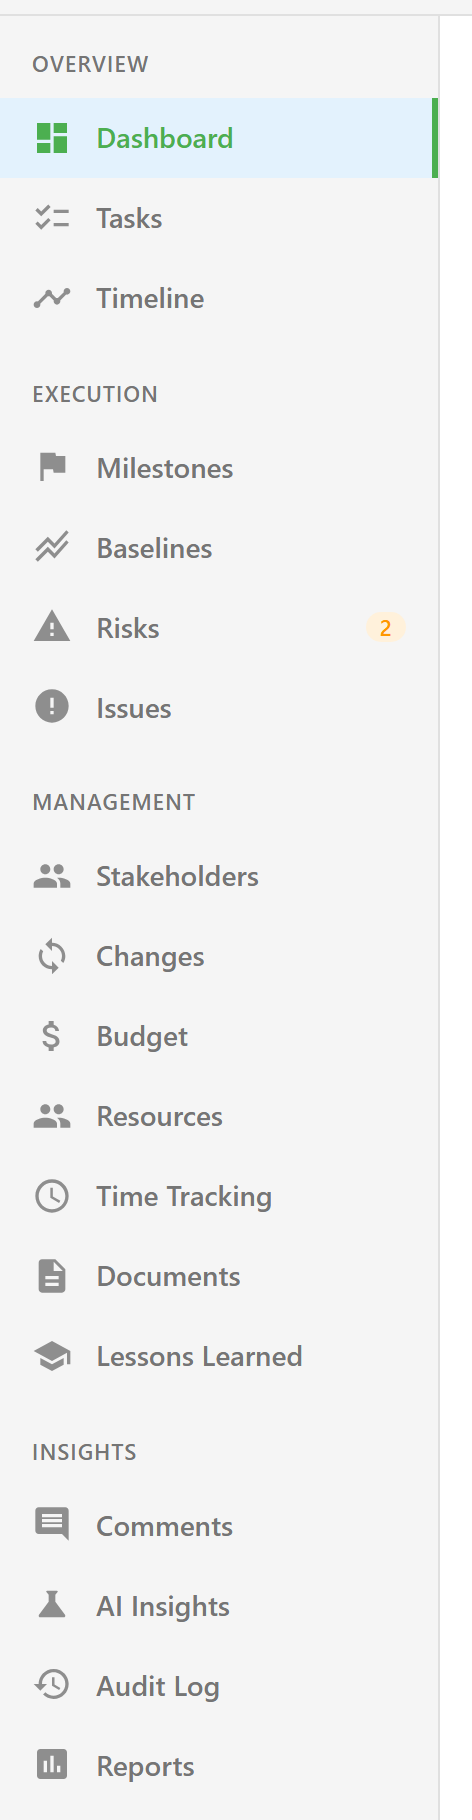
The project screen is a header, a grouped navigation sidebar, and one section at a time. Every section is deep-linkable.
| Element |
Notes |
| Back arrow |
Returns to the project list. |
| Project code |
Shown when set. |
| Project name |
— |
| Health badge |
Shows the stored value rather than its label, so At Risk reads At_risk. |
| Status badge |
Draft, Planning, Active, On Hold, Completed, or Cancelled. |
| Percent complete |
Derived from linked board tasks. |
| Gear |
Opens Project Settings. |
| Section |
Shows |
Needs |
| Dashboard |
Budget, Schedule, Scope, and Quality tiles; linked boards; milestone timeline; risks; issues; team; recent activity. Two inner tabs, Overview and Charts. |
Dates for the schedule tile, expenses for budget, a linked board for progress |
| Tasks |
Linked task boards, with Link Board and + New Board. |
— |
| Timeline |
Gantt across day, week, or month, with Milestones, Dependencies, Critical Path, and Baseline toggles and board, milestone, and assignee filters. |
A linked board with tasks |
| Section |
Shows |
Needs |
| Milestones |
The milestone register. Feeds the Scope tile. |
— |
| Baselines |
Saved schedule snapshots and comparison against them. |
A schedule worth snapshotting |
| Risks |
The risk register, scored by probability and impact. Badge counts risks that are not closed. |
— |
| Issues |
The issue log. Badge counts issues that are neither closed nor resolved. |
— |
| Dependencies |
Milestone dependency graph. Off by default. |
Enabled in Features |
| Section |
Shows |
Needs |
| Stakeholders |
The stakeholder register with influence, interest, and engagement strategy. |
— |
| Changes |
Change requests. Badge counts submitted and pending ones. |
— |
| Budget |
Total, spent, committed, remaining; expense ledger; category breakdown. |
A budget total and expenses |
| Resources |
The project team, with role, allocation, dates, and each person’s overall utilisation. |
— |
| Time Tracking |
Logged hours aggregated from linked boards, read-only. |
Boards, Advanced Mode, estimated hours, logged time |
| Documents |
The project’s Asset Library folder, with a toggle to the legacy linked-documents view. |
— |
| Lessons Learned |
Lessons recorded as success, improvement, or failure. |
— |
| Section |
Shows |
Needs |
| Comments |
Project-wide discussion. |
— |
| Earned Value |
PV, EV, AC, CPI, SPI, EAC, ETC, VAC, TCPI. Off by default. |
Enabled in Features; estimated hours on tasks |
| Workload |
Utilisation per person by week or month, from remaining estimated task hours against a fixed 40-hour week. Off by default. |
Enabled in Features; assigned tasks with estimates |
| AI Insights |
Predictions, analysis, and generated reports. |
AI enabled for the service |
| Audit Log |
The project’s change history. |
— |
| Reports |
Status Reports, Risk Summary, Executive Brief, Meeting Agenda, Task Summary, and the report history. |
— |
Earned Value, Workload, and Dependencies are hidden on every new project until enabled in Project Settings → Features. Dashboard, Tasks, Timeline, and Settings can never be hidden.
| Control |
Notes |
| Grid View / List View |
Two layouts of the same projects. Not remembered between visits. |
| Search |
Matches name, description, and code. |
| All Statuses |
Draft, Planning, Active, On Hold, Completed, Cancelled. |
| All Health |
On Track, At Risk, Critical. |
| From / To |
From filters on start date, To on end date. A project with no start date disappears once From is set. |
| Sort by |
Name, Status, Health, Progress, Start Date, End Date, Created Date, plus any custom field, with an ascending toggle. |
| Select |
Enters selection mode for bulk actions. |
Cards show status, health, code, name, description, progress, start and end dates, and budget spent against total. The end date turns red when it has passed and the project is neither completed nor cancelled.
For the fields behind these, see the project fields reference.
