
Connect a data source
Dashboards draws data it does not own. Before a widget can show anything, Data Hub in the same service needs a connection, and that connection needs to have been scanned.
Create the connection
Section titled “Create the connection”Open Data Hub under Data in the service and add a connection to your database or data file. Data Hub owns every field on that form — the driver, the address, the credentials. For a cloud provider, Connecting to cloud data covers the credentials each one needs.
The examples in these pages use a DuckDB file connected as Food sales (DuckDB).
Let it scan
Section titled “Let it scan”After a connection saves, Data Hub scans it and registers every table it finds as a managed dataset. This is automatic and you do not create the datasets yourself.
Scanning is the step people skip past. Until it finishes, the connection exists but there is nothing to bind to, and the Data panel in the designer will be empty. Wait for the datasets to appear in Data Hub before you go looking for them in a dashboard.
Build views for what you want to chart
Section titled “Build views for what you want to chart”A managed dataset is the raw table. That is fine for a table widget but rarely what you want on a chart — charting a transactions table gives you one bar per transaction.
Build a data view in Data Hub for each chart you plan to make: a monthly rollup, a filtered subset, a join across two tables. The work of getting the numbers right belongs in the view rather than the widget, because a view can be reused by every widget and every dashboard in the service.
The examples use four views over the restaurant data — monthly popularity, menu items, restaurants, and dishes — each built for a specific chart.
Check it from the designer
Section titled “Check it from the designer”Open a dashboard and choose Data in the toolbar.
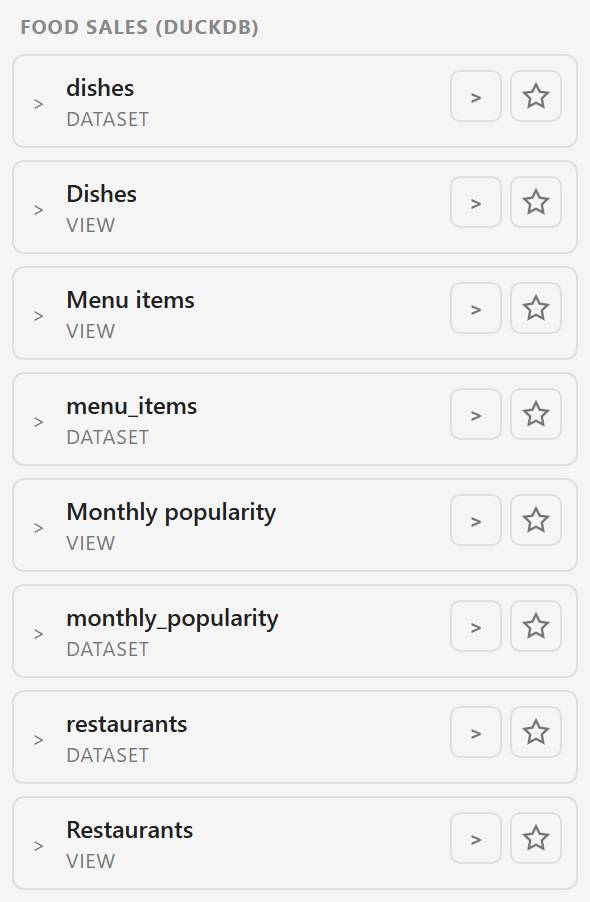
Everything bindable in the service appears here, grouped under the connection it came from. Each entry is tagged VIEW or DATASET. Expand one with the chevron on the left to see its columns; those columns are what you drag onto widgets.
The star-shaped Pin control on the right pins an entry to this dashboard and puts it under Pinned. Pin each dataset or data view before asking the dashboard AI to use it. Having a connection in Data Hub or an entry in the Data panel is not enough. Dashboards and AI usage covers the full workflow.
If the panel is empty
Section titled “If the panel is empty”There are three causes, in the order worth checking. The service has no Data Hub connection at all. The connection exists but its scan has not finished, or found nothing. Or you are looking at a dashboard in a different service — the Data panel only ever shows sources from the service the dashboard belongs to.
With sources showing, add and bind widgets turns them into charts. How data reaches a widget explains the whole chain if you would rather understand it before building on it.