
Charts quickstart
This builds a real process map, fills in what each step costs, reads the numbers the module works out, and publishes the result. It takes about twenty minutes.
You need a service you can edit.
1. Open the workspace
Section titled “1. Open the workspace”Open a service and choose Charts under Content Modules.
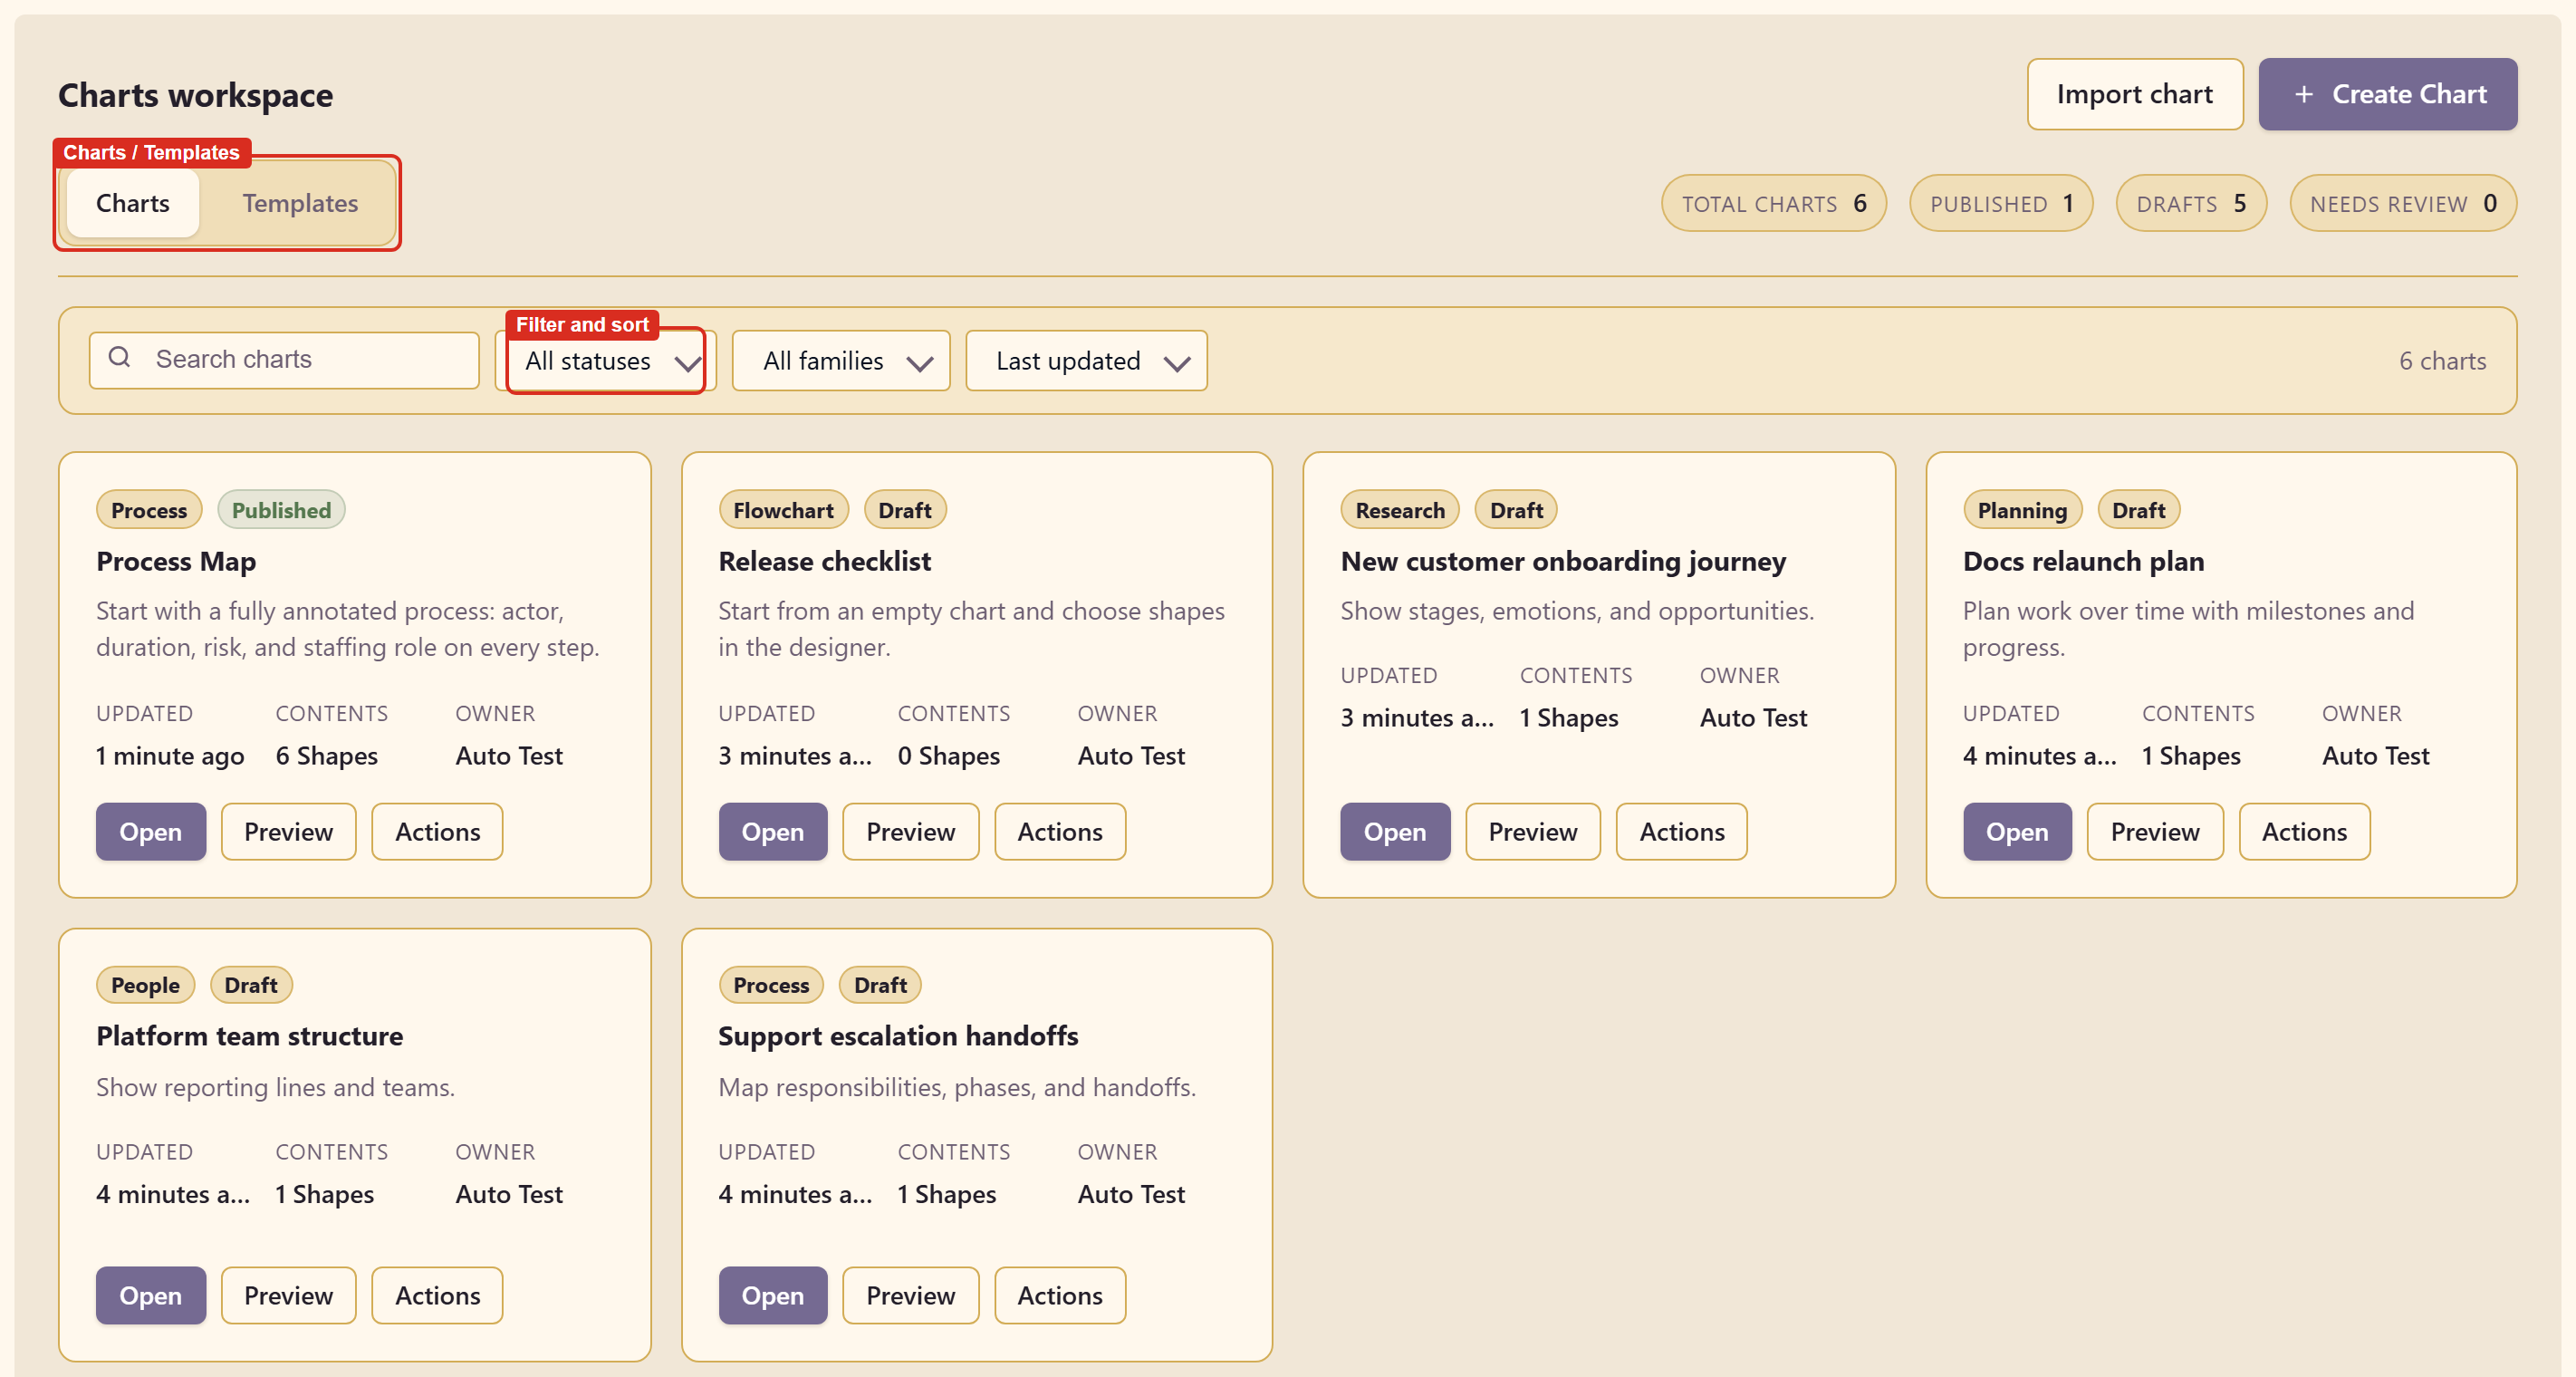
The counts across the top tell you how many charts exist and how many are published, still drafts, or waiting for review.
2. Start from a template
Section titled “2. Start from a template”Choose Create Chart. This opens the Templates tab.
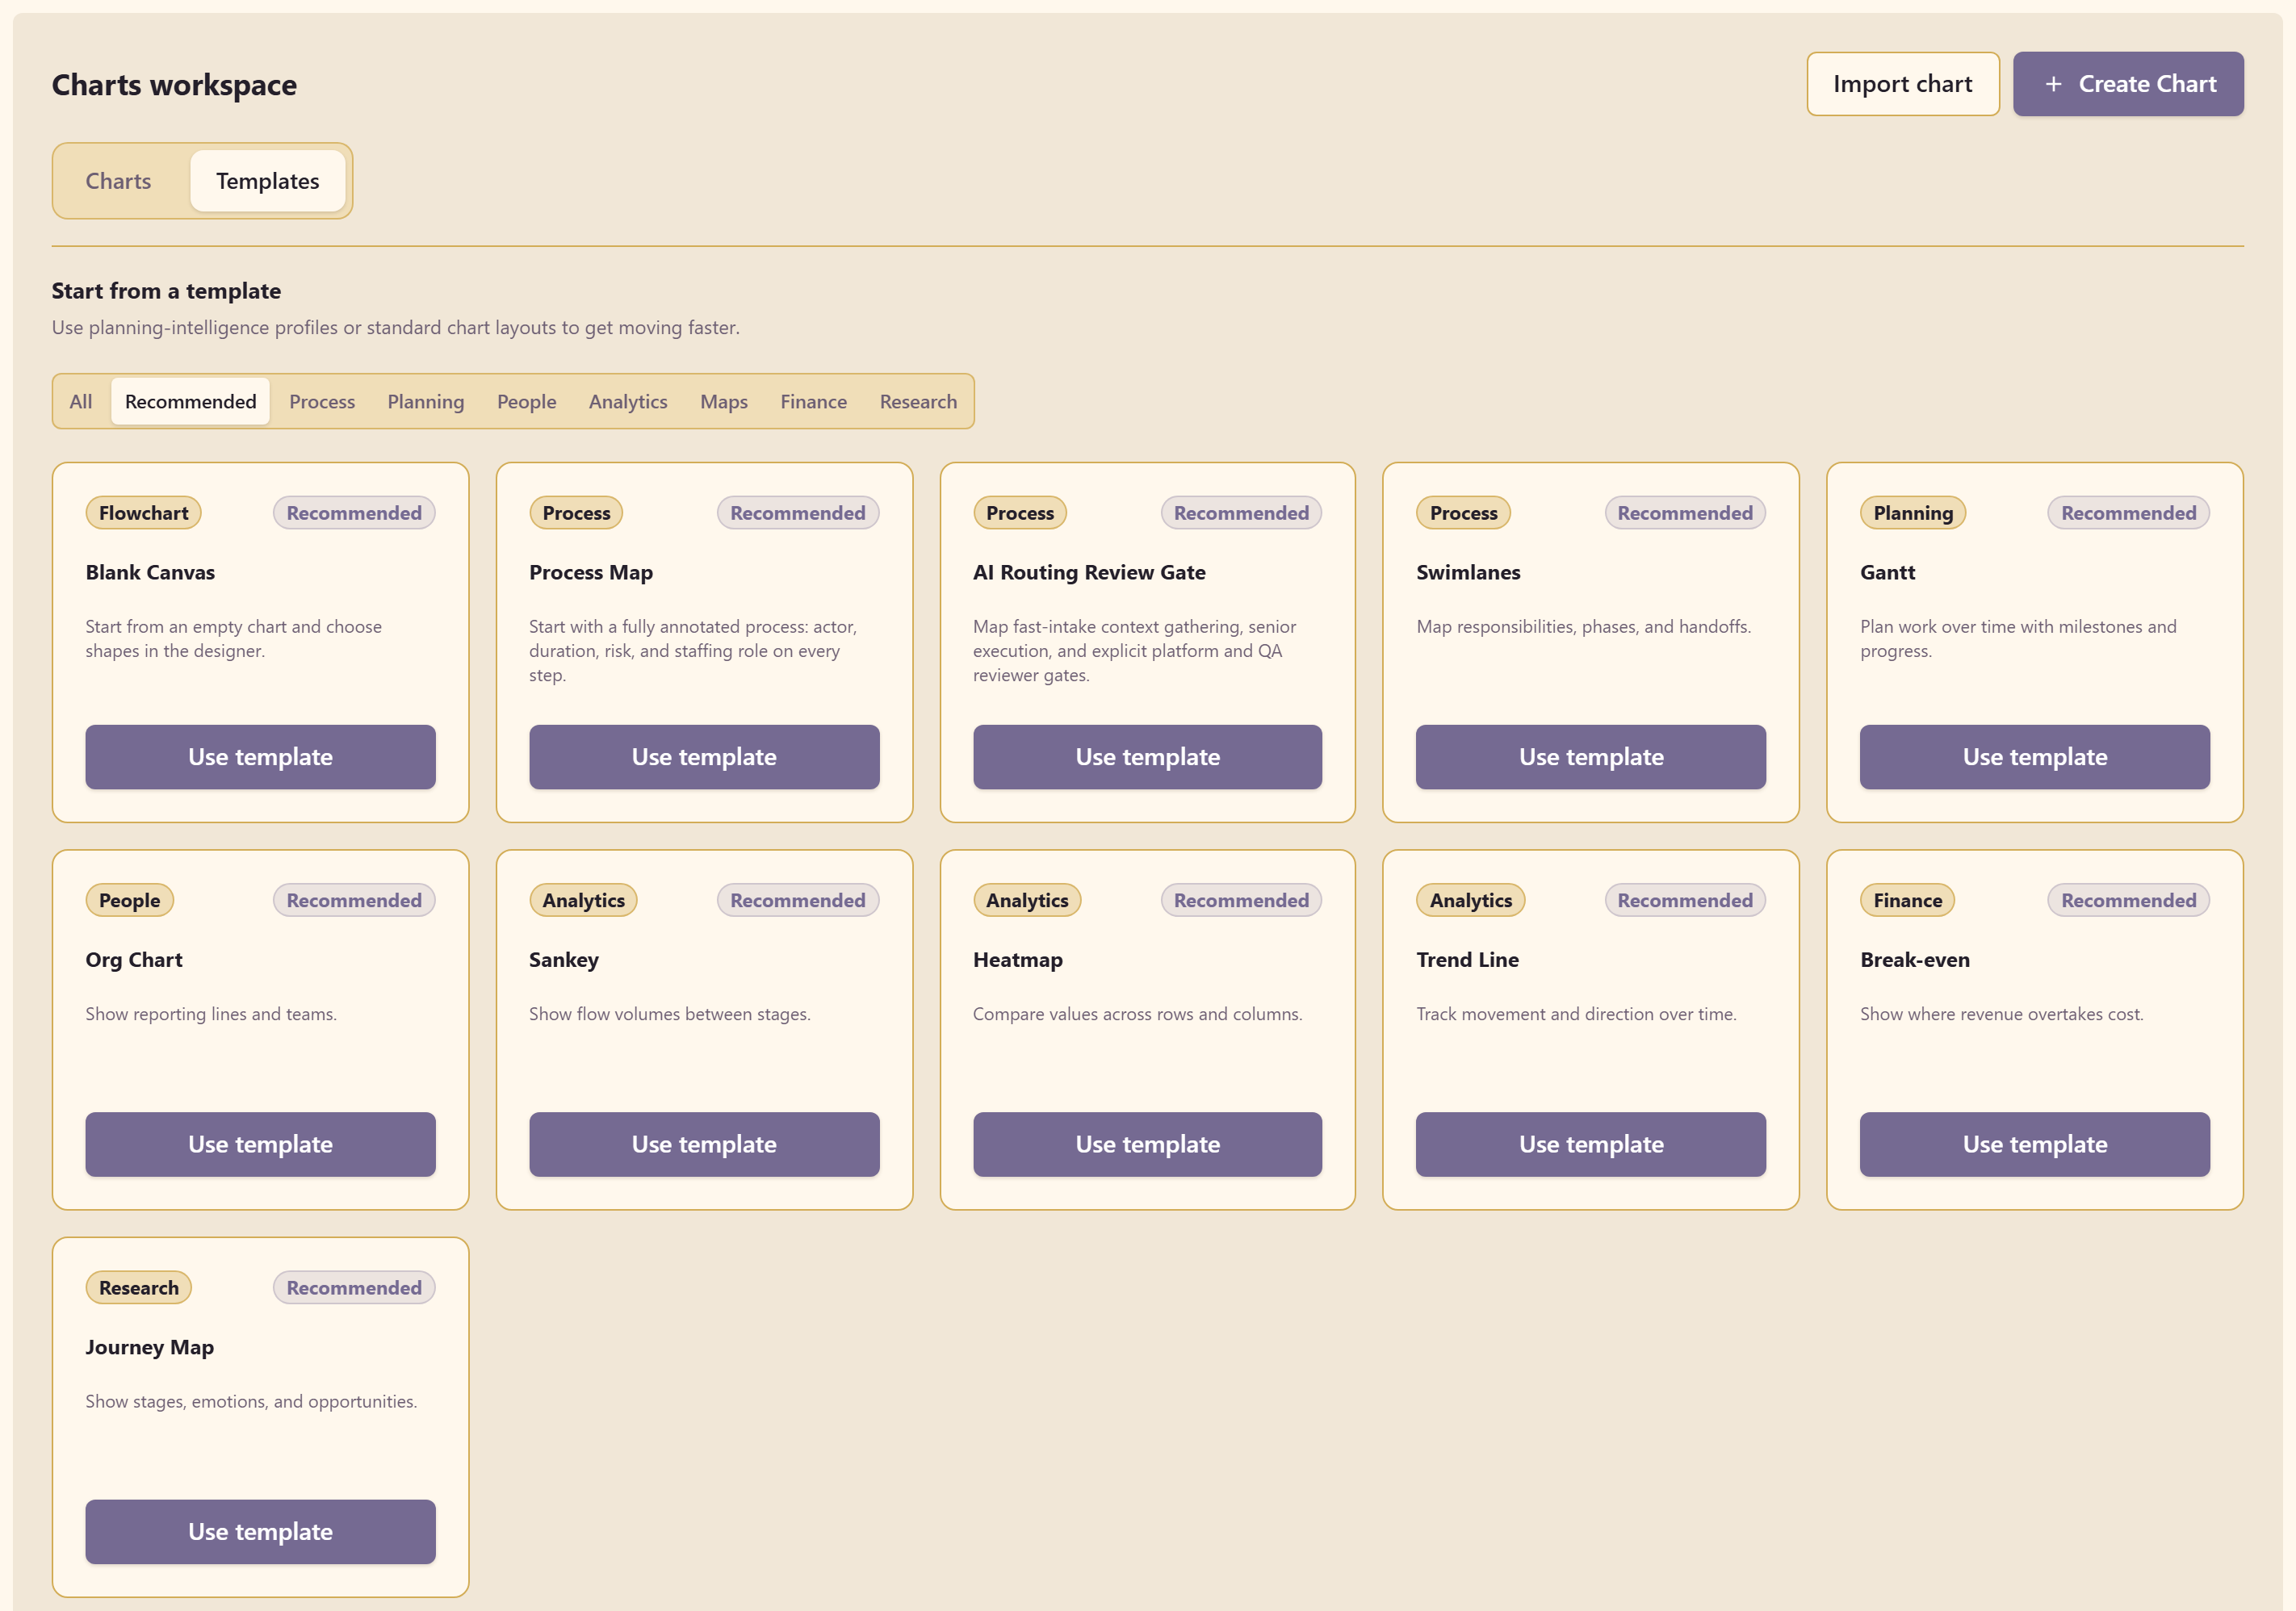
There are 25 templates in eight families. Choose Process Map under Process — it arrives with a working process already drawn and annotated, which is far easier to learn from than an empty page.
Choose Use template. The chart is created and the designer opens.
3. Look at what you got
Section titled “3. Look at what you got”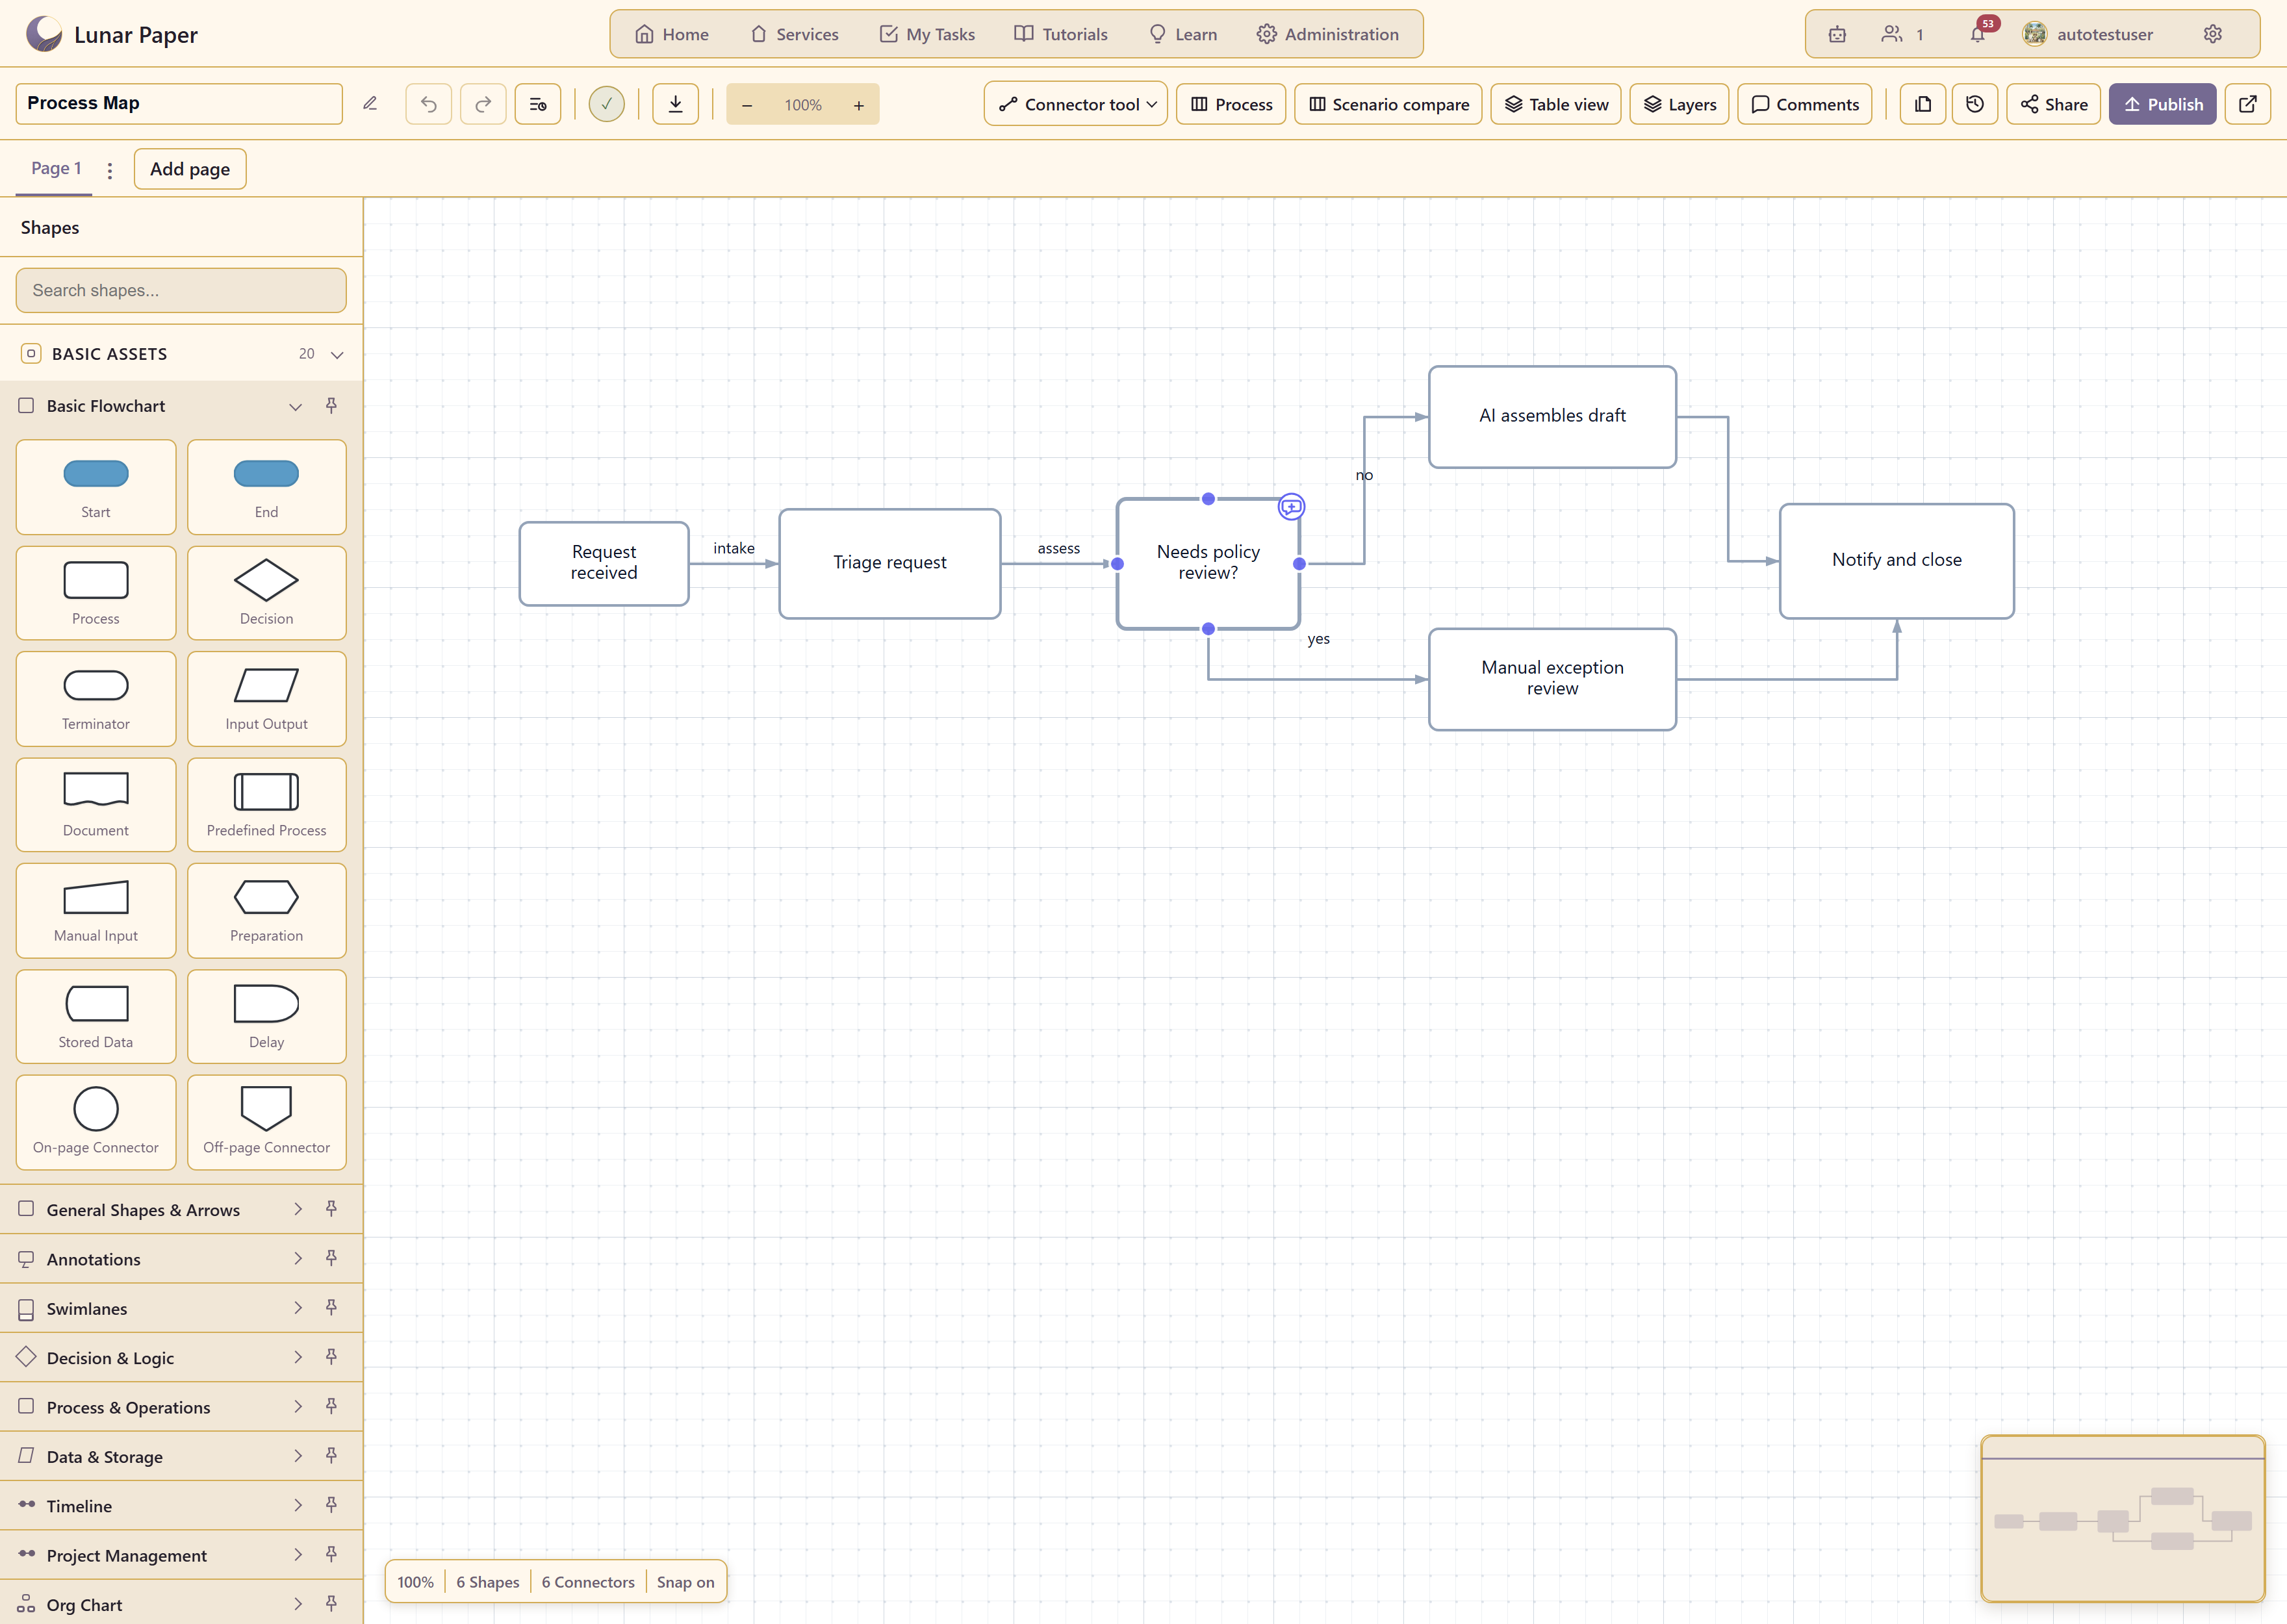
Six shapes and six connectors, laid out as a support intake process: a request arrives, someone triages it, a decision splits the work between an AI draft and a manual review, and both routes end at the same close step.
The status bar at the bottom confirms the count and tells you snapping is on.
4. Rename it
Section titled “4. Rename it”The name field is at the top left. Type over it — “Support intake” or whatever describes your real process.
Names can be changed whenever you like, from here or from the chart’s card in the workspace.
5. Add a step
Section titled “5. Add a step”Find Process in the Basic Flowchart category on the left and drag it onto the canvas.
To connect it, use the Connector tool in the toolbar and drag from one shape’s edge to another.
Everything snaps to the grid, which keeps the diagram tidy without you aligning anything by hand.
6. Fill in what each step costs
Section titled “6. Fill in what each step costs”Choose Table view in the toolbar. The diagram becomes a table with one row per step.
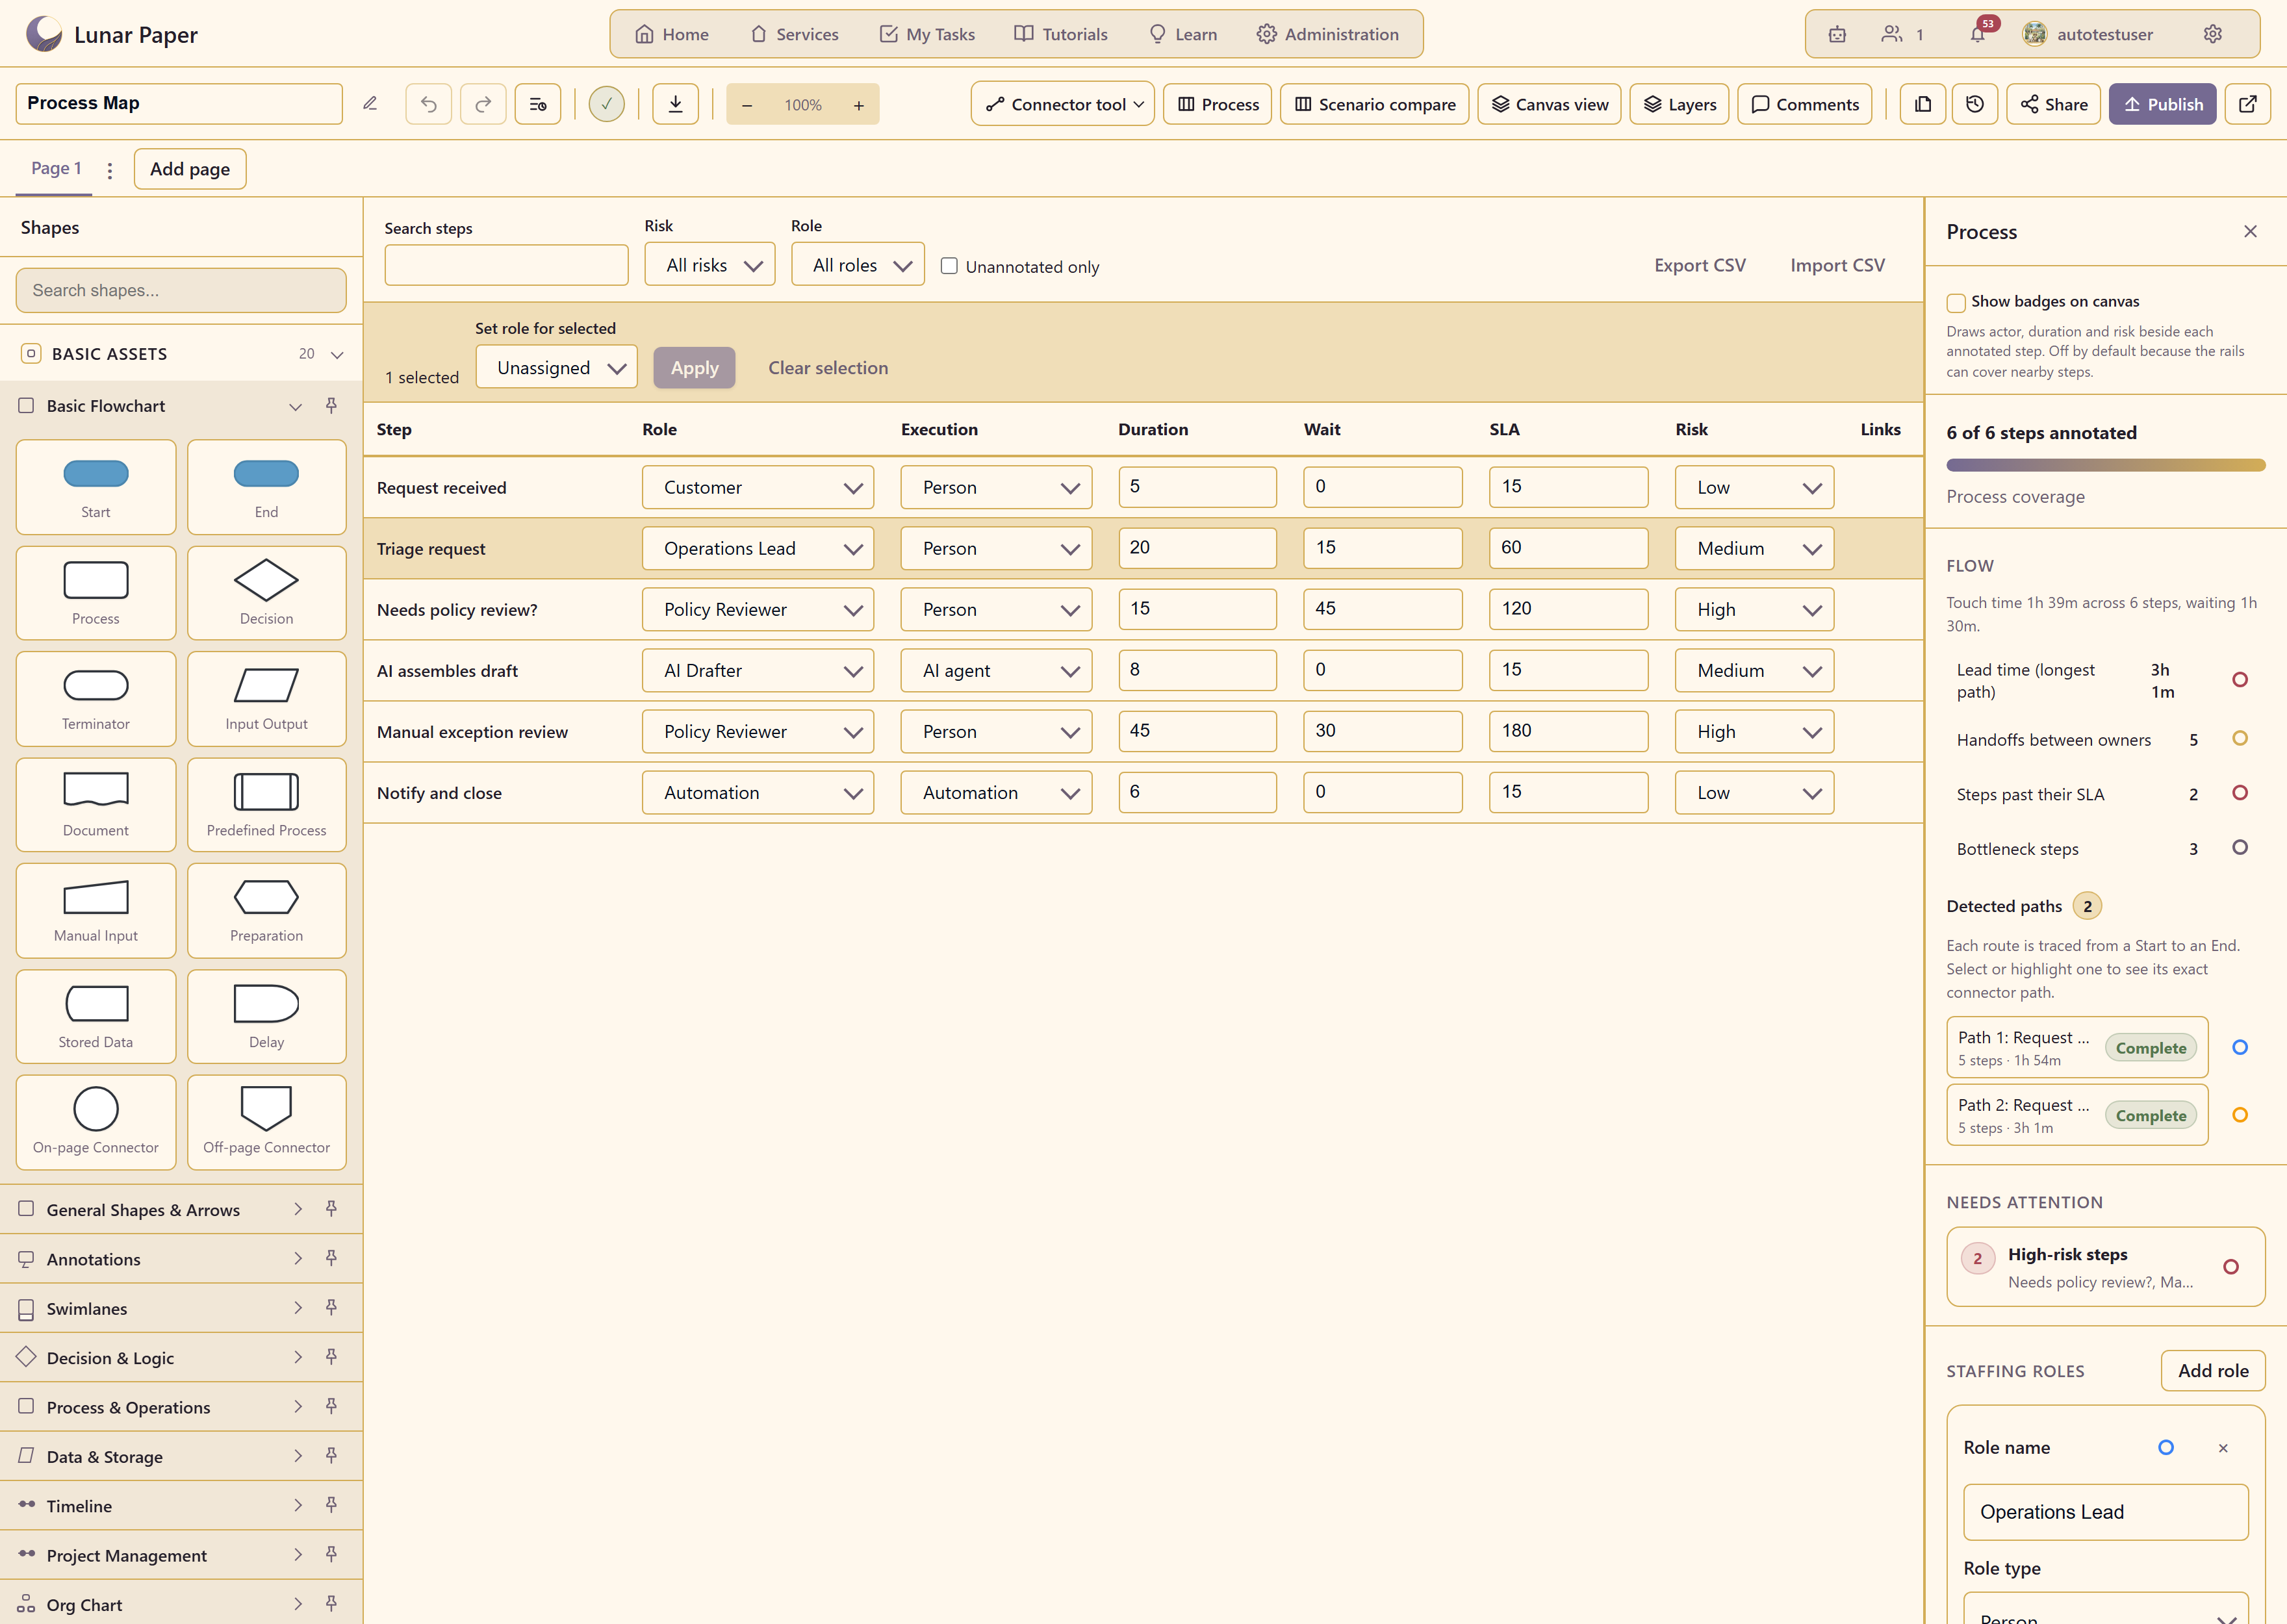
For each step, set:
Role — who owns it. Execution — whether a person, an AI agent, or an automation does the work. Duration — the hands-on time in minutes. Wait — how long it sits before anyone picks it up. SLA — how long it is allowed to take. Risk — low, medium, or high.
The template arrives with all six steps filled in, so use it as a guide for what good values look like, then edit them to match reality.
Be honest about Wait. It is usually much larger than duration, and it is where most of the elapsed time in a real process hides.
7. Read what the chart now knows
Section titled “7. Read what the chart now knows”The Process panel on the right updates as you type.
In the example it reports touch time of 1h 39m across six steps with 1h 30m of waiting, a lead time of 3h 1m along the longest route, five handoffs between owners, two steps past their SLA, and three bottlenecks. It has found two complete paths from start to end and flagged two high-risk steps under Needs attention.
That is the payoff. Nobody had to calculate anything — the numbers come from the step data you just entered.
Watch the gap between touch time and lead time. In this process the work itself takes 1h 39m but the whole thing takes 3h 1m. The difference is waiting and handoffs, and that is almost always where the improvement is.
8. Publish it
Section titled “8. Publish it”Choose Publish.
The dialog offers the Internal Publisher, which hosts a read-only copy inside Lunar Paper for signed-in users. Switch on Allow comments if you want feedback, and write a version note saying what changed.
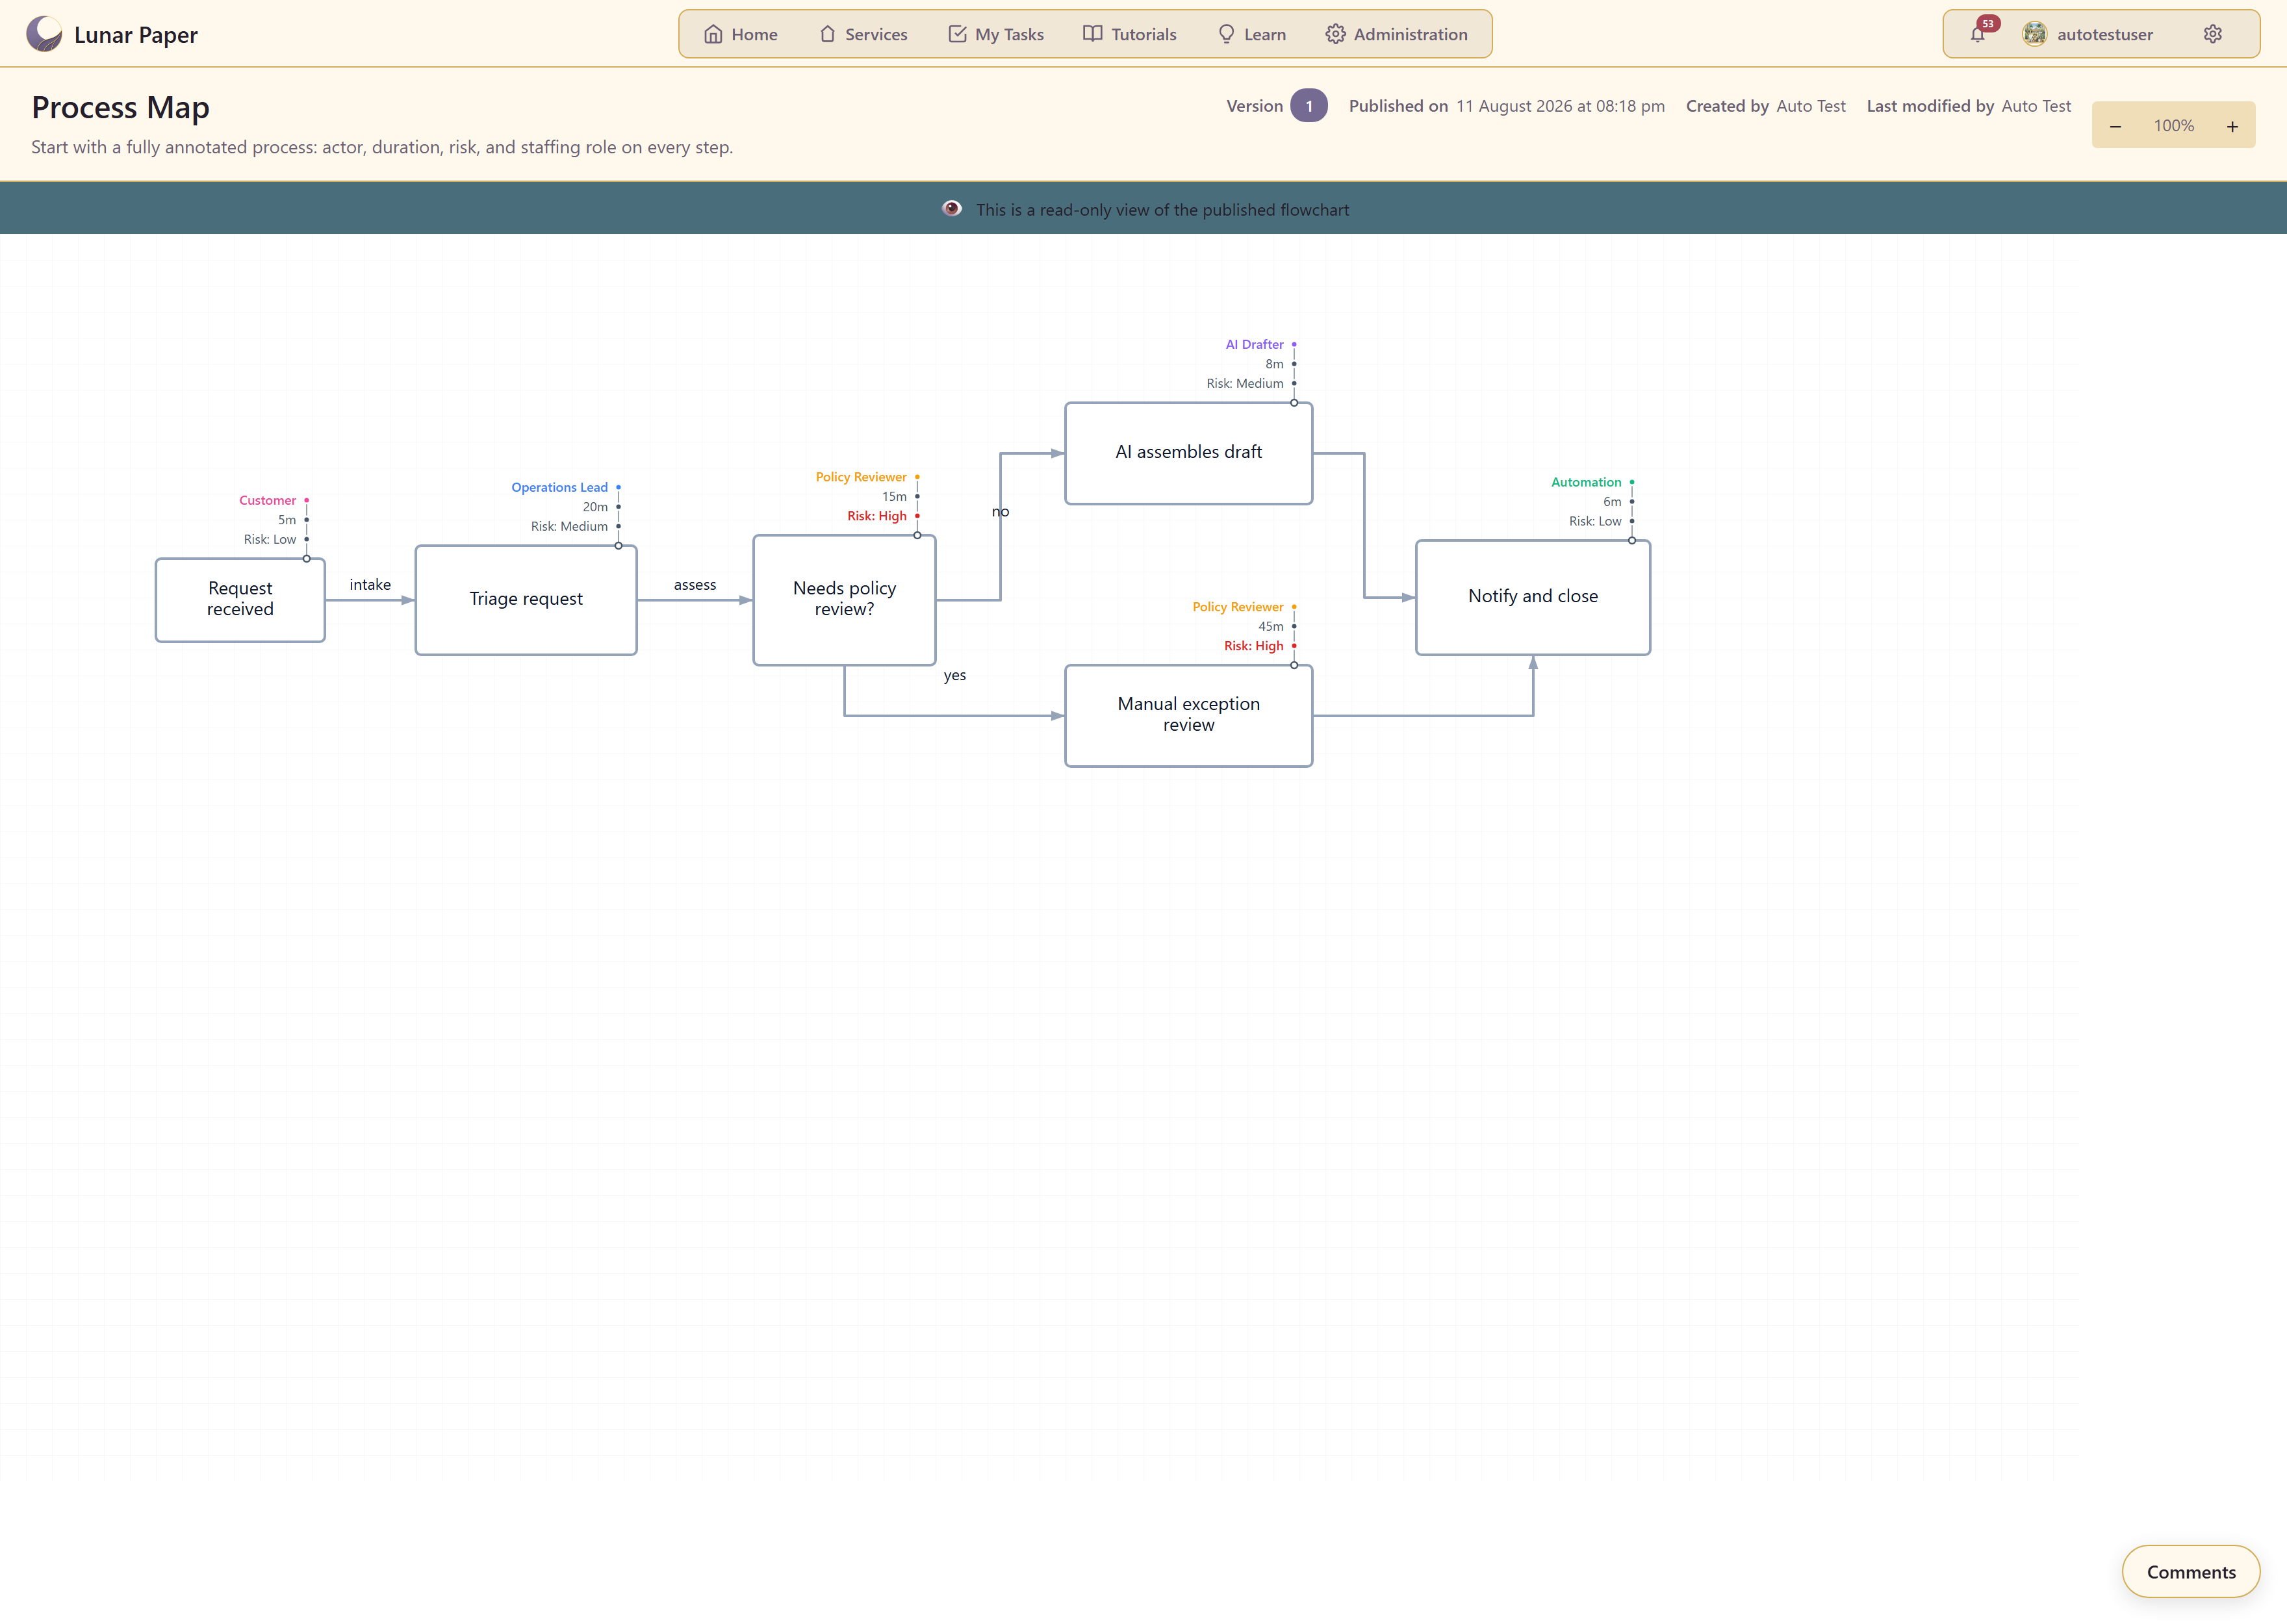
The published copy shows the version number, when it was published, who created and last modified it, and a banner making clear it is read only.
9. Send it to someone
Section titled “9. Send it to someone”Back in the workspace, the chart’s Actions menu has Copy link for the published address, and export options.
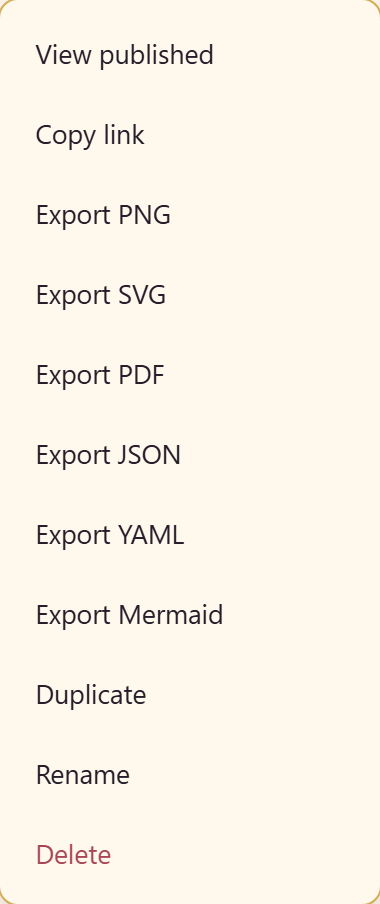
Use Export PNG for a slide, Export PDF for a document, and Export Mermaid if it is going into a code repository or a Markdown file.
What you have
Section titled “What you have”A process map that is both a picture and a set of numbers, published for the service to read.
Map a process end to end is the fuller version of what you just did, including drawing from scratch. When you want to change the process rather than describe it, Improve a process with scenarios covers comparing a future state against today’s.