
Draw a diagram from scratch
Not every chart is a process. Network diagrams, org charts, wireframes, and mind maps are all worth drawing here, and none of them need annotation. This covers the drawing itself.
Start with a blank canvas
Section titled “Start with a blank canvas”Choose Create Chart, then Blank Canvas from the templates.
Find the shapes
Section titled “Find the shapes”The library is on the left, with a search box at the top and 20 categories underneath.
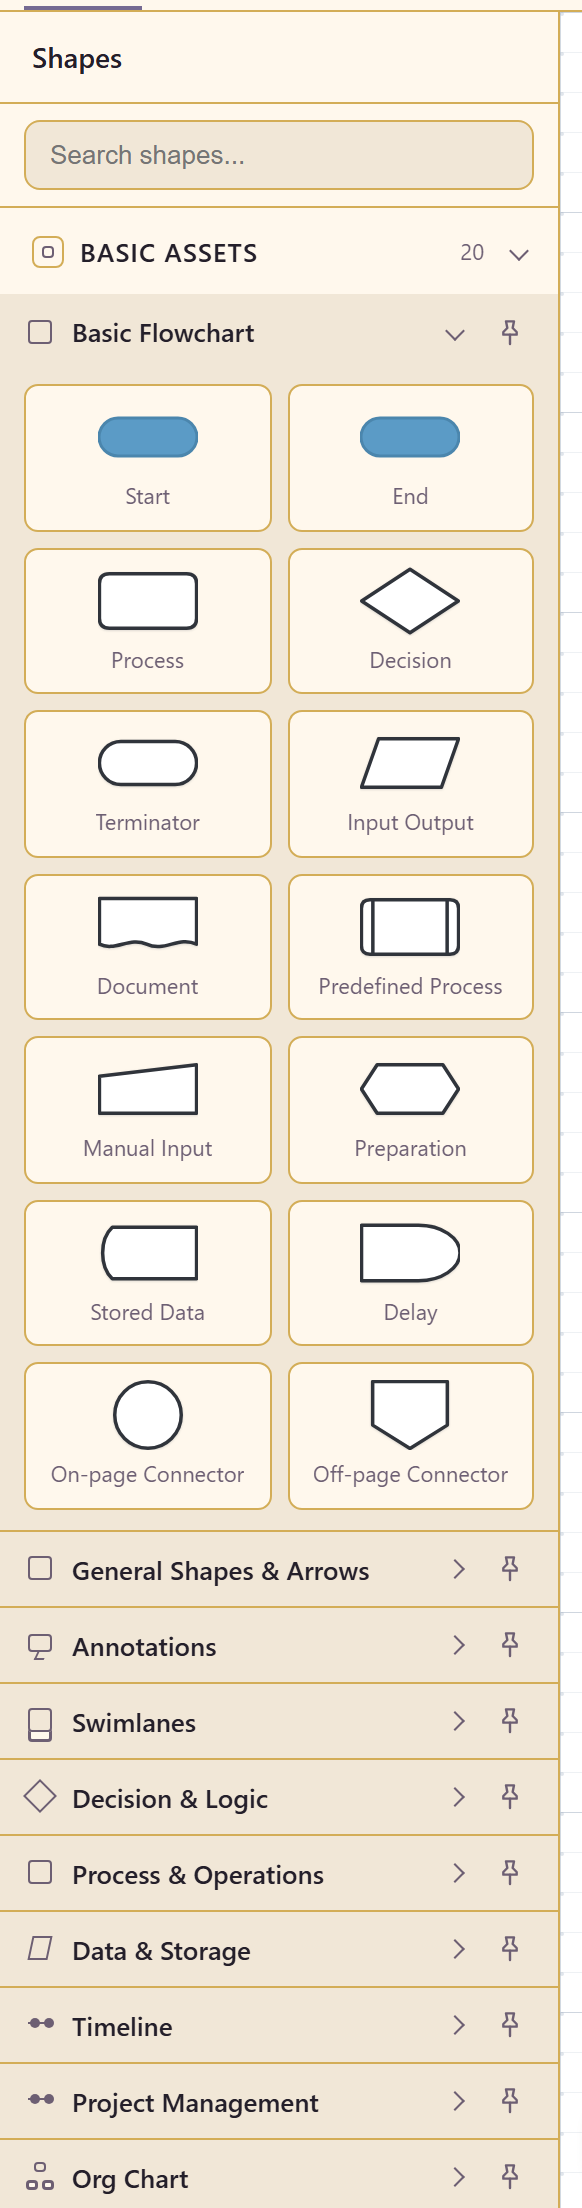
Search first. It looks across every category at once, which is quicker than remembering whether a gateway lives under BPMN or Decision & Logic.
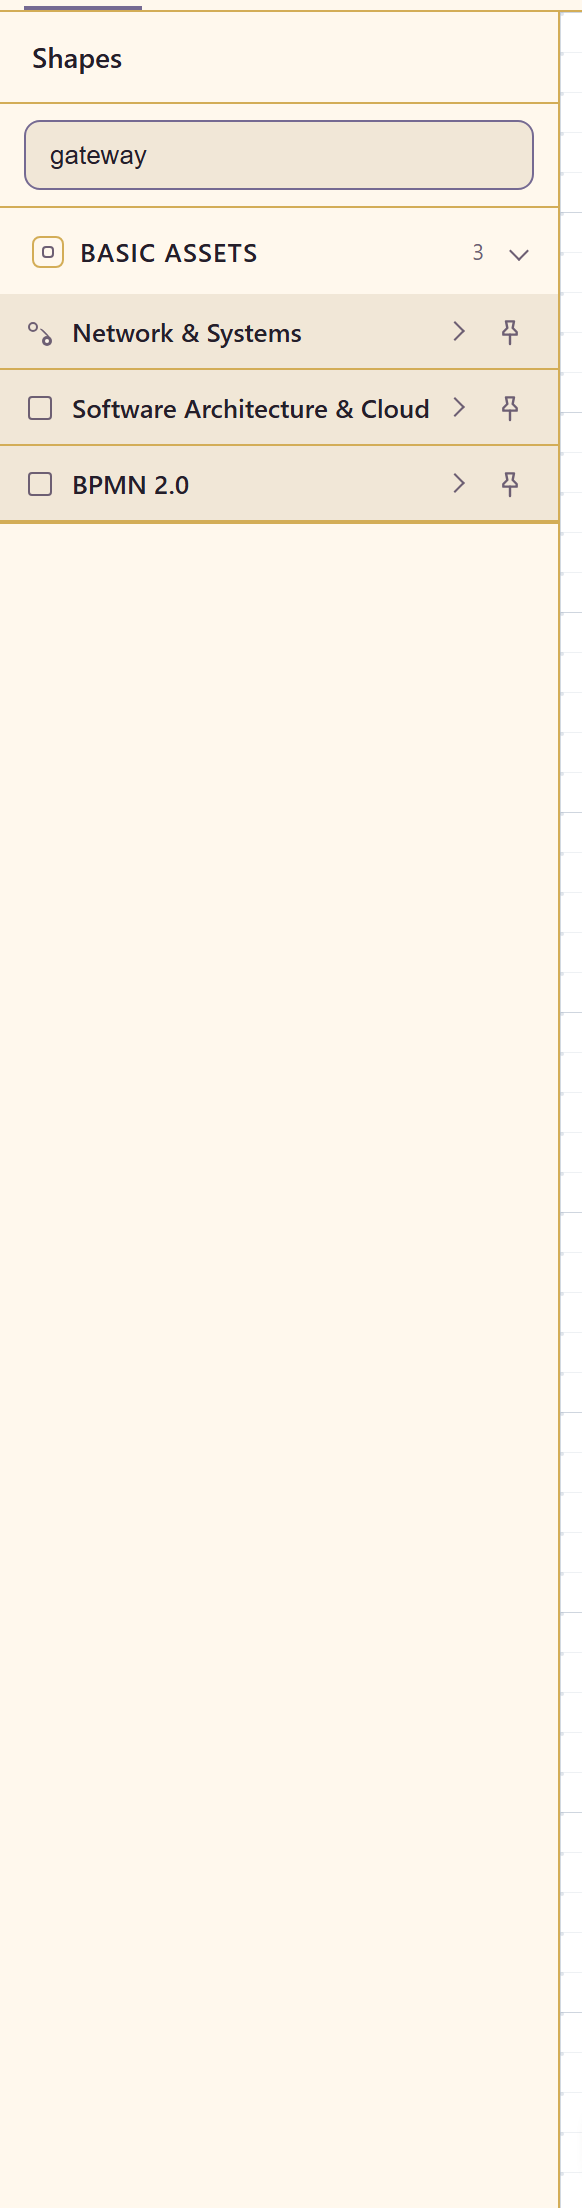
If you are working in one notation for a while, pin its category with the pin icon so it stays at the top.
Shape libraries lists all 353 shapes and which category each is in.
Place and connect
Section titled “Place and connect”Drag a shape onto the canvas. Drag its edges to resize.
Everything snaps to the grid, which is what keeps a hand-drawn diagram looking deliberate. The status bar shows whether snapping is on, along with the shape and connector counts.
For connections, choose the Connector tool and drag from one shape to another. The tool offers several line styles — straight, elbow, curved, dashed — and different endpoints.
Label things properly
Section titled “Label things properly”Type into a shape to label it. Selecting a shape also opens its properties, where you can change its fill, stroke, and text.
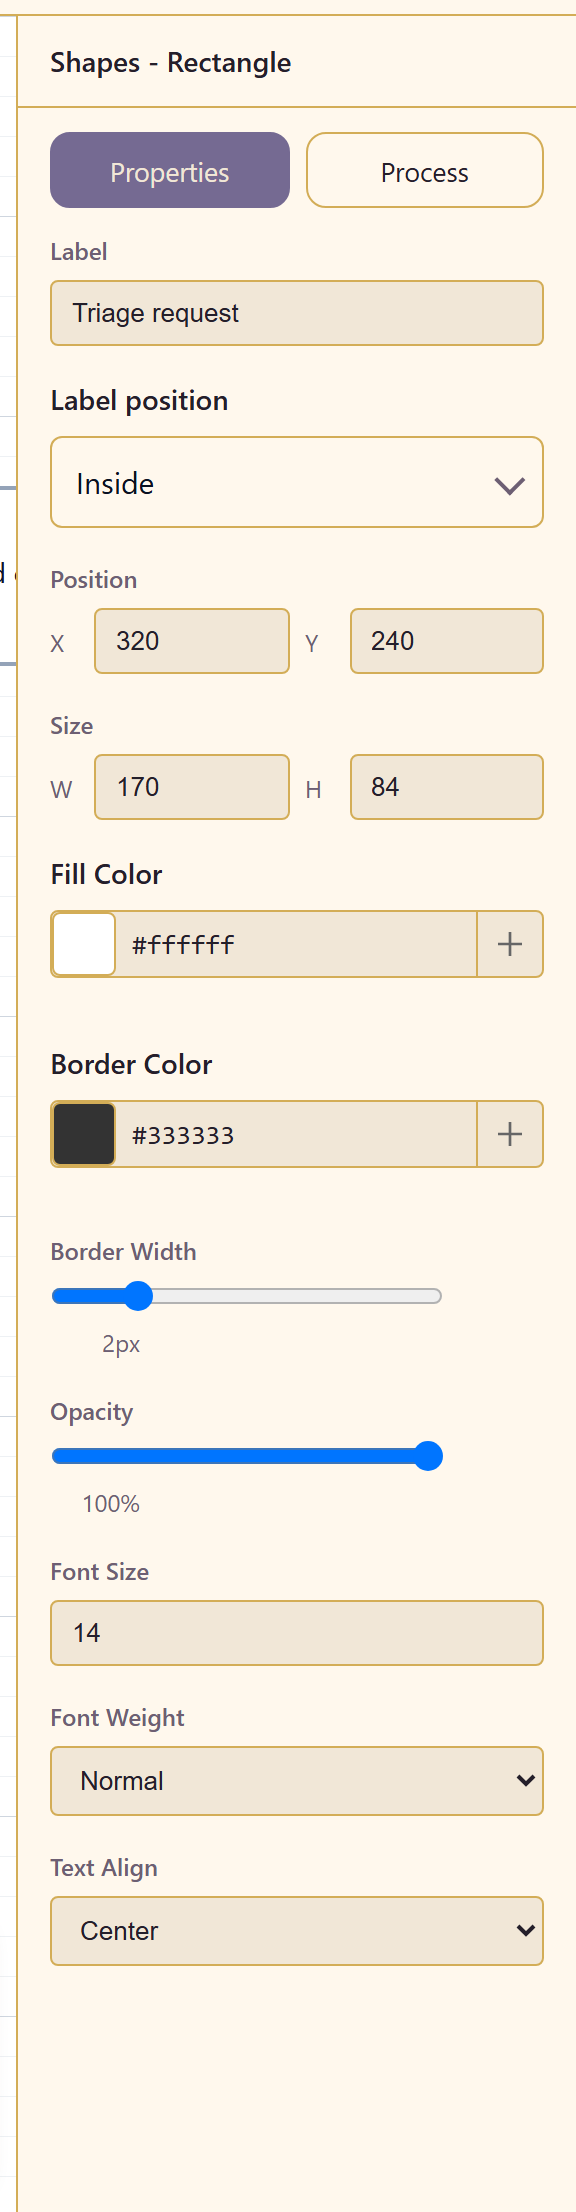
Labels are what the diagram is for. A box called “System” helps nobody; “Billing API” does. The same goes for connectors — label them wherever the reason for the link is not obvious from the two things it joins.
Keep it readable
Section titled “Keep it readable”A few habits do most of the work.
Flow in one direction, usually left to right or top to bottom. A diagram that changes direction halfway is much harder to follow than one with more boxes.
Leave space. Crowded shapes with connectors threading between them are the main reason diagrams get ignored.
Use the Annotations category — text boxes, notes, callouts, boundaries — to explain things that are not shapes. A boundary drawn around three services says “these are one system” more clearly than a paragraph elsewhere.
Check the minimap in the bottom corner now and then. If the diagram has grown past the frame, it is a sign to split it across pages.
Undo is there
Section titled “Undo is there”Undo and Redo are in the toolbar. Layout is cheap to experiment with; move things around until the diagram reads well.
Related
Section titled “Related”Organise a large chart covers pages and layers. Map a process end to end covers the case where the diagram is a process and you want it measured.