
Review submissions and analytics
Responses can be read in two ways. Individual records answer “what did this person say?” and can be replayed in the form the respondent originally saw. Aggregate analytics answer “is this form working?”: how many people started, how many finished, and how long it took them. The two are collected separately, which is why they sometimes disagree.
Read response counts
Section titled “Read response counts”The form card shows total, current-month, and current-week response counts.
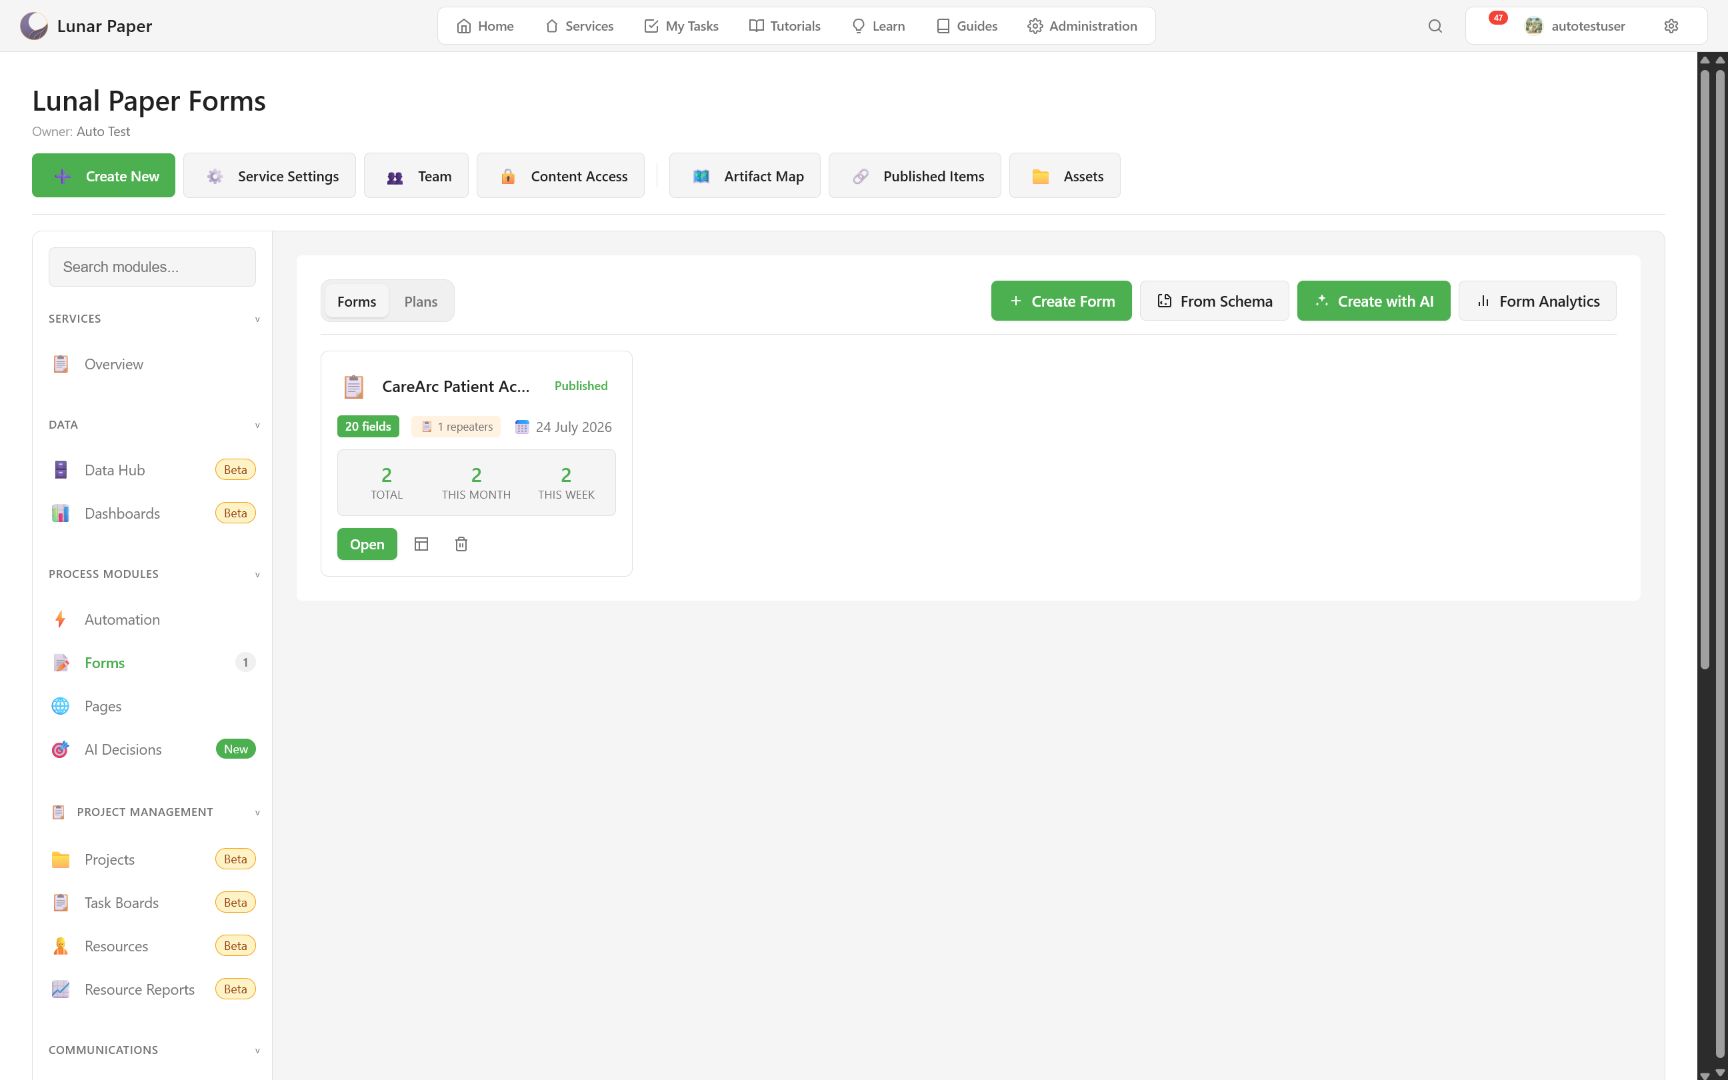
Counts confirm that responses were stored, but they do not replace reading the records themselves.
Open the submissions table
Section titled “Open the submissions table”Choose View Data on the form card.
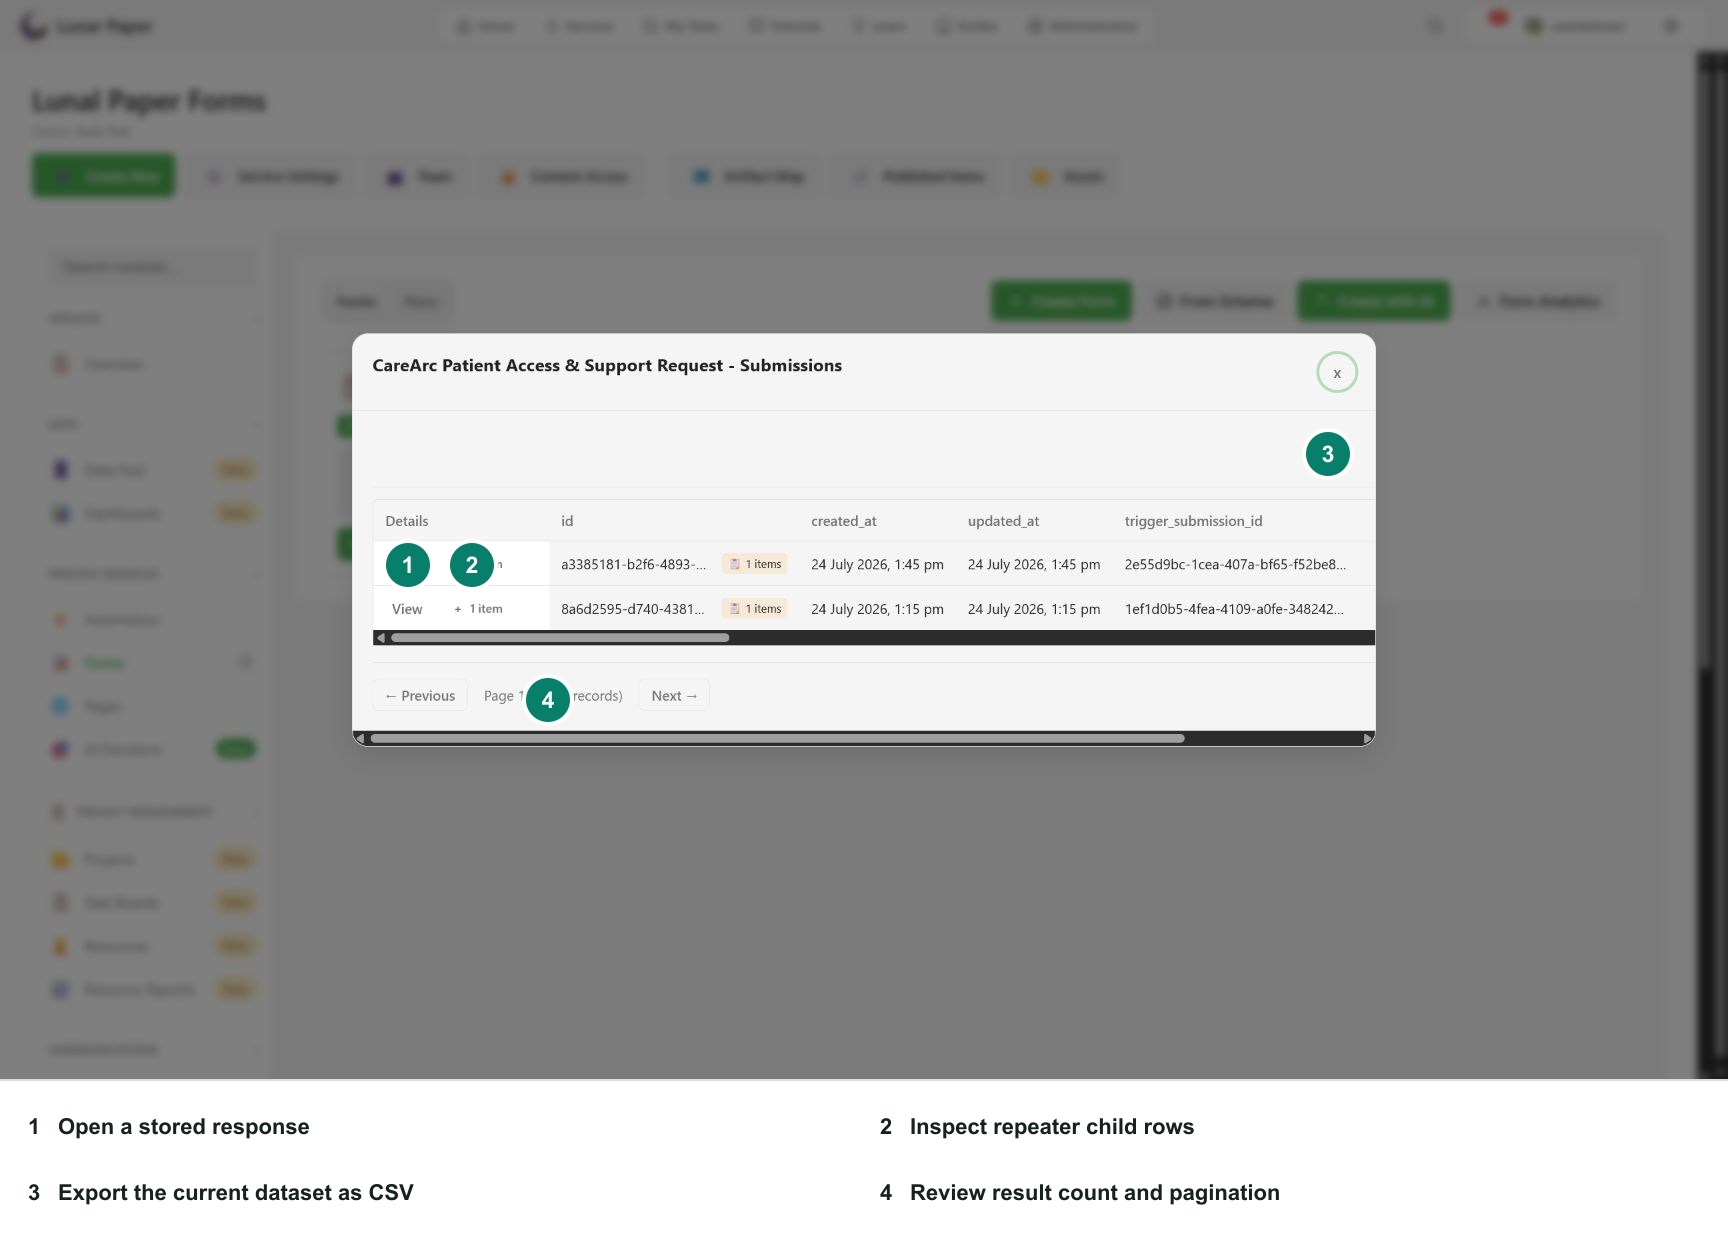
The table includes infrastructure metadata and one column for each stored field. Use horizontal scrolling for wide forms. Choose:
- View to replay a response in the read-only renderer;
- the item-count action to inspect repeater child rows;
- Export CSV for the current form dataset;
- Previous and Next for paginated results.
Replay a submitted form
Section titled “Replay a submitted form”The submitted-form view records the form version and engine, then renders the answers with controls disabled.
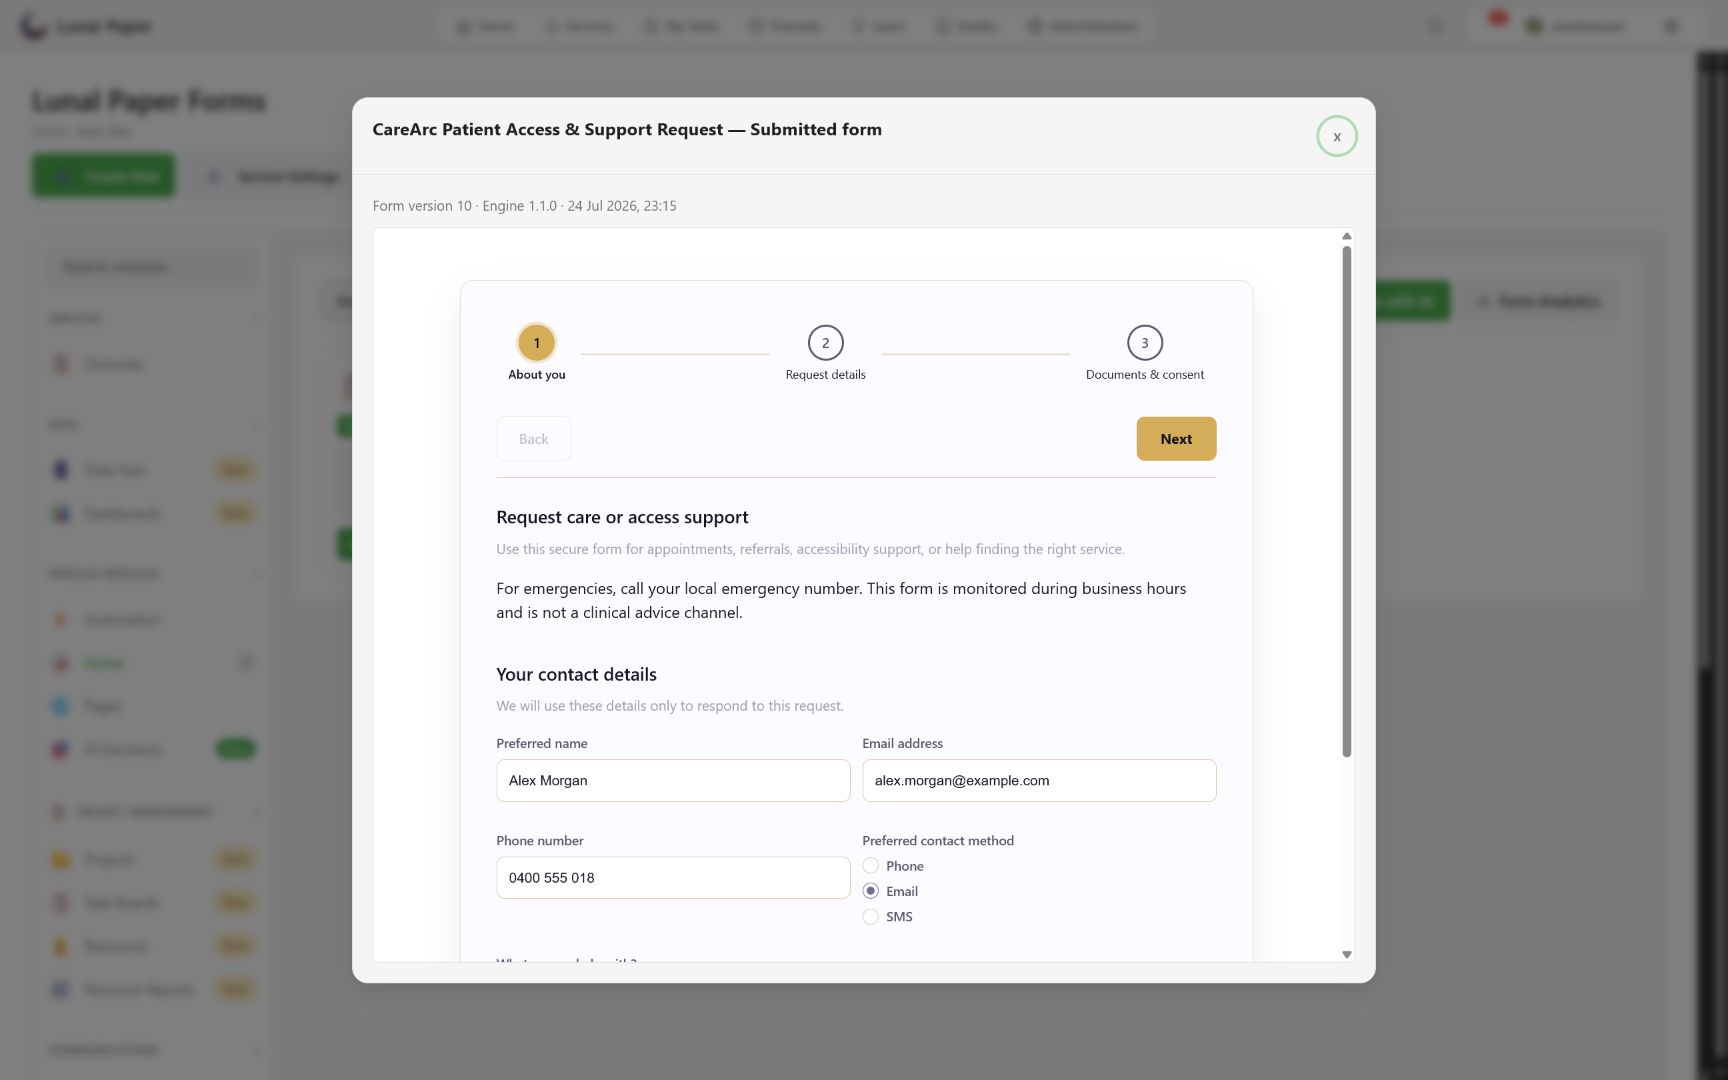
This is the clearest way to understand the answer in its original layout. Historical responses use the submitted version’s schema rather than silently adopting the current draft.
Files and signatures are exposed through guarded download links. Treat exports and downloads according to the service’s data policy.
Export data
Section titled “Export data”Choose Export CSV from the submissions dialog. Repeaters remain related child data; do not assume every nested record can be flattened without loss. Use the item viewer or the service data tools when child-row analysis is required.
Before sharing an export:
- verify the form and service;
- check the date and result count;
- remove data not needed by the recipient;
- use an approved storage and transfer location.
Review analytics
Section titled “Review analytics”Choose Form Analytics from the Forms catalogue.
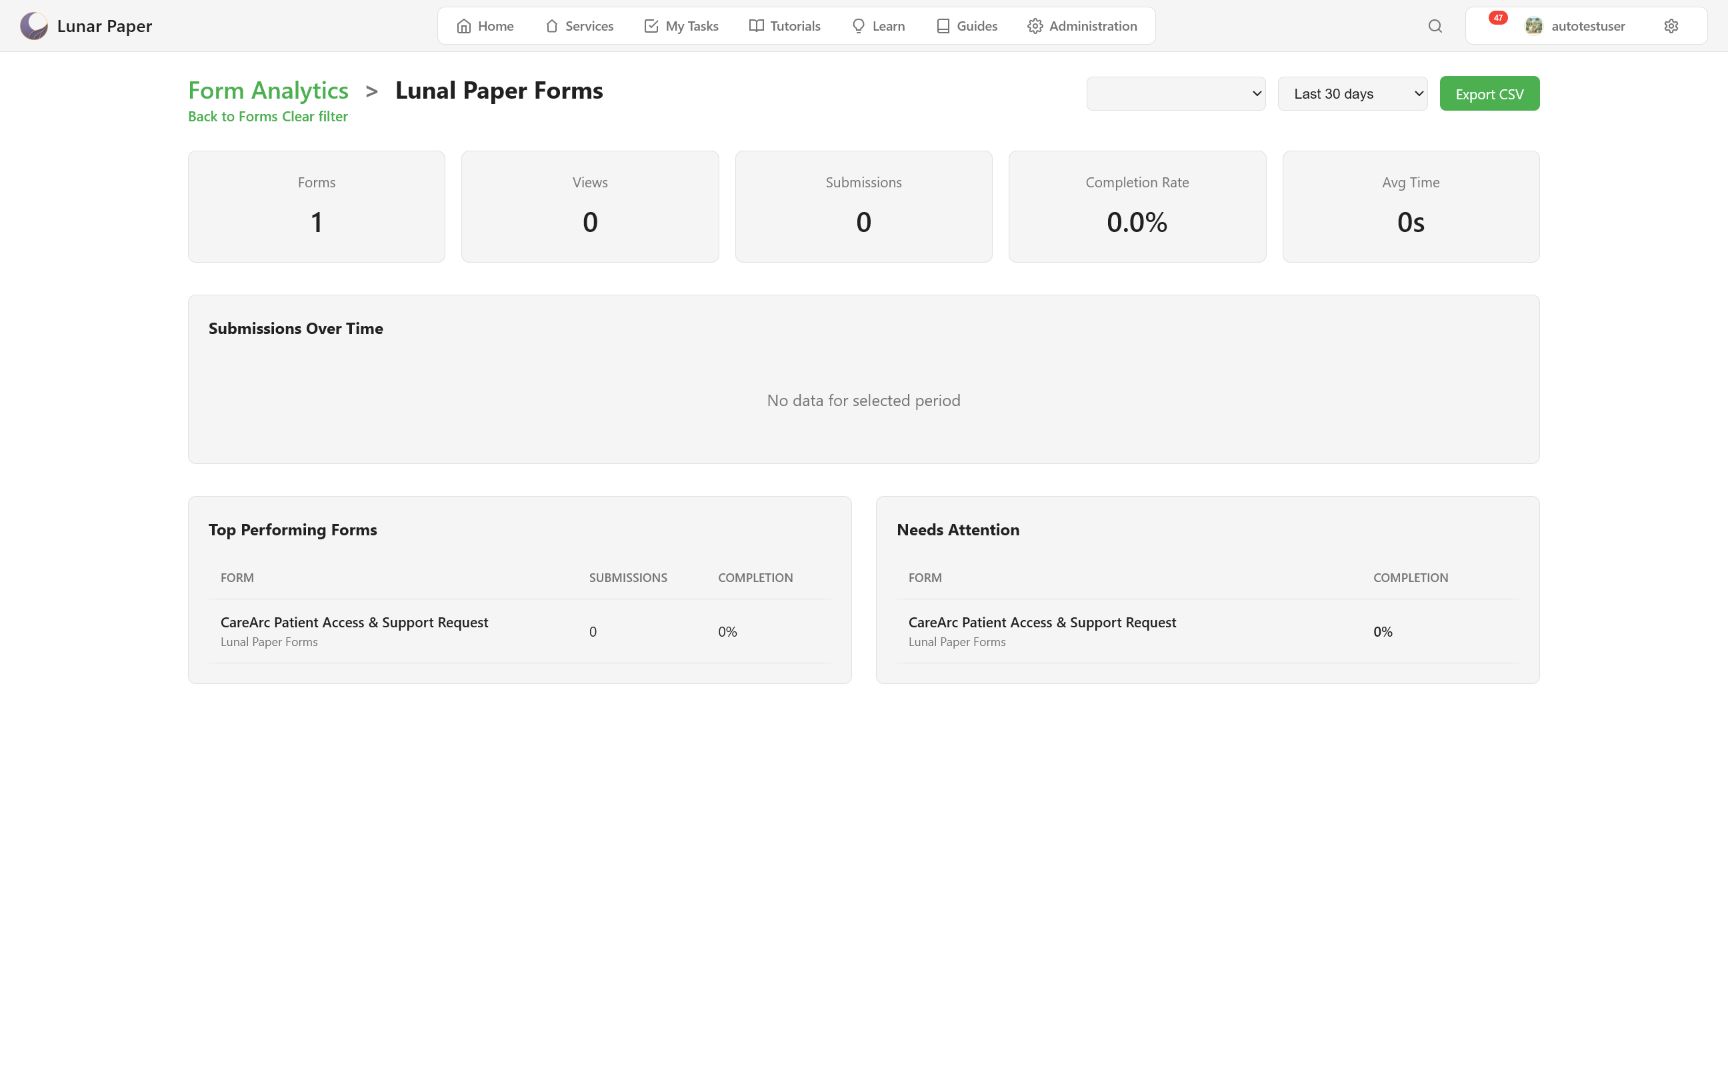
Analytics provides service and date filters, CSV export, form count, views, submissions, completion rate, average time, submission trend, top forms, and forms needing attention. Analytics events may update on a different cadence from stored-response counts; use the submissions table as the authoritative record of stored responses.
Every column, action, and metric is defined in the submissions and analytics reference. If a count looks wrong, start with Forms troubleshooting.