
Build a chart with the AI assistant
Inside the designer the assistant knows what is on your canvas, and it can change it. That makes it useful for the parts of diagramming that are tedious rather than difficult — adding fifteen shapes, tidying a layout, building a swimlane structure.
Open it
Section titled “Open it”The assistant is the sparkle button in the top bar, to the left of your avatar. It opens as a panel down the right side of the designer.
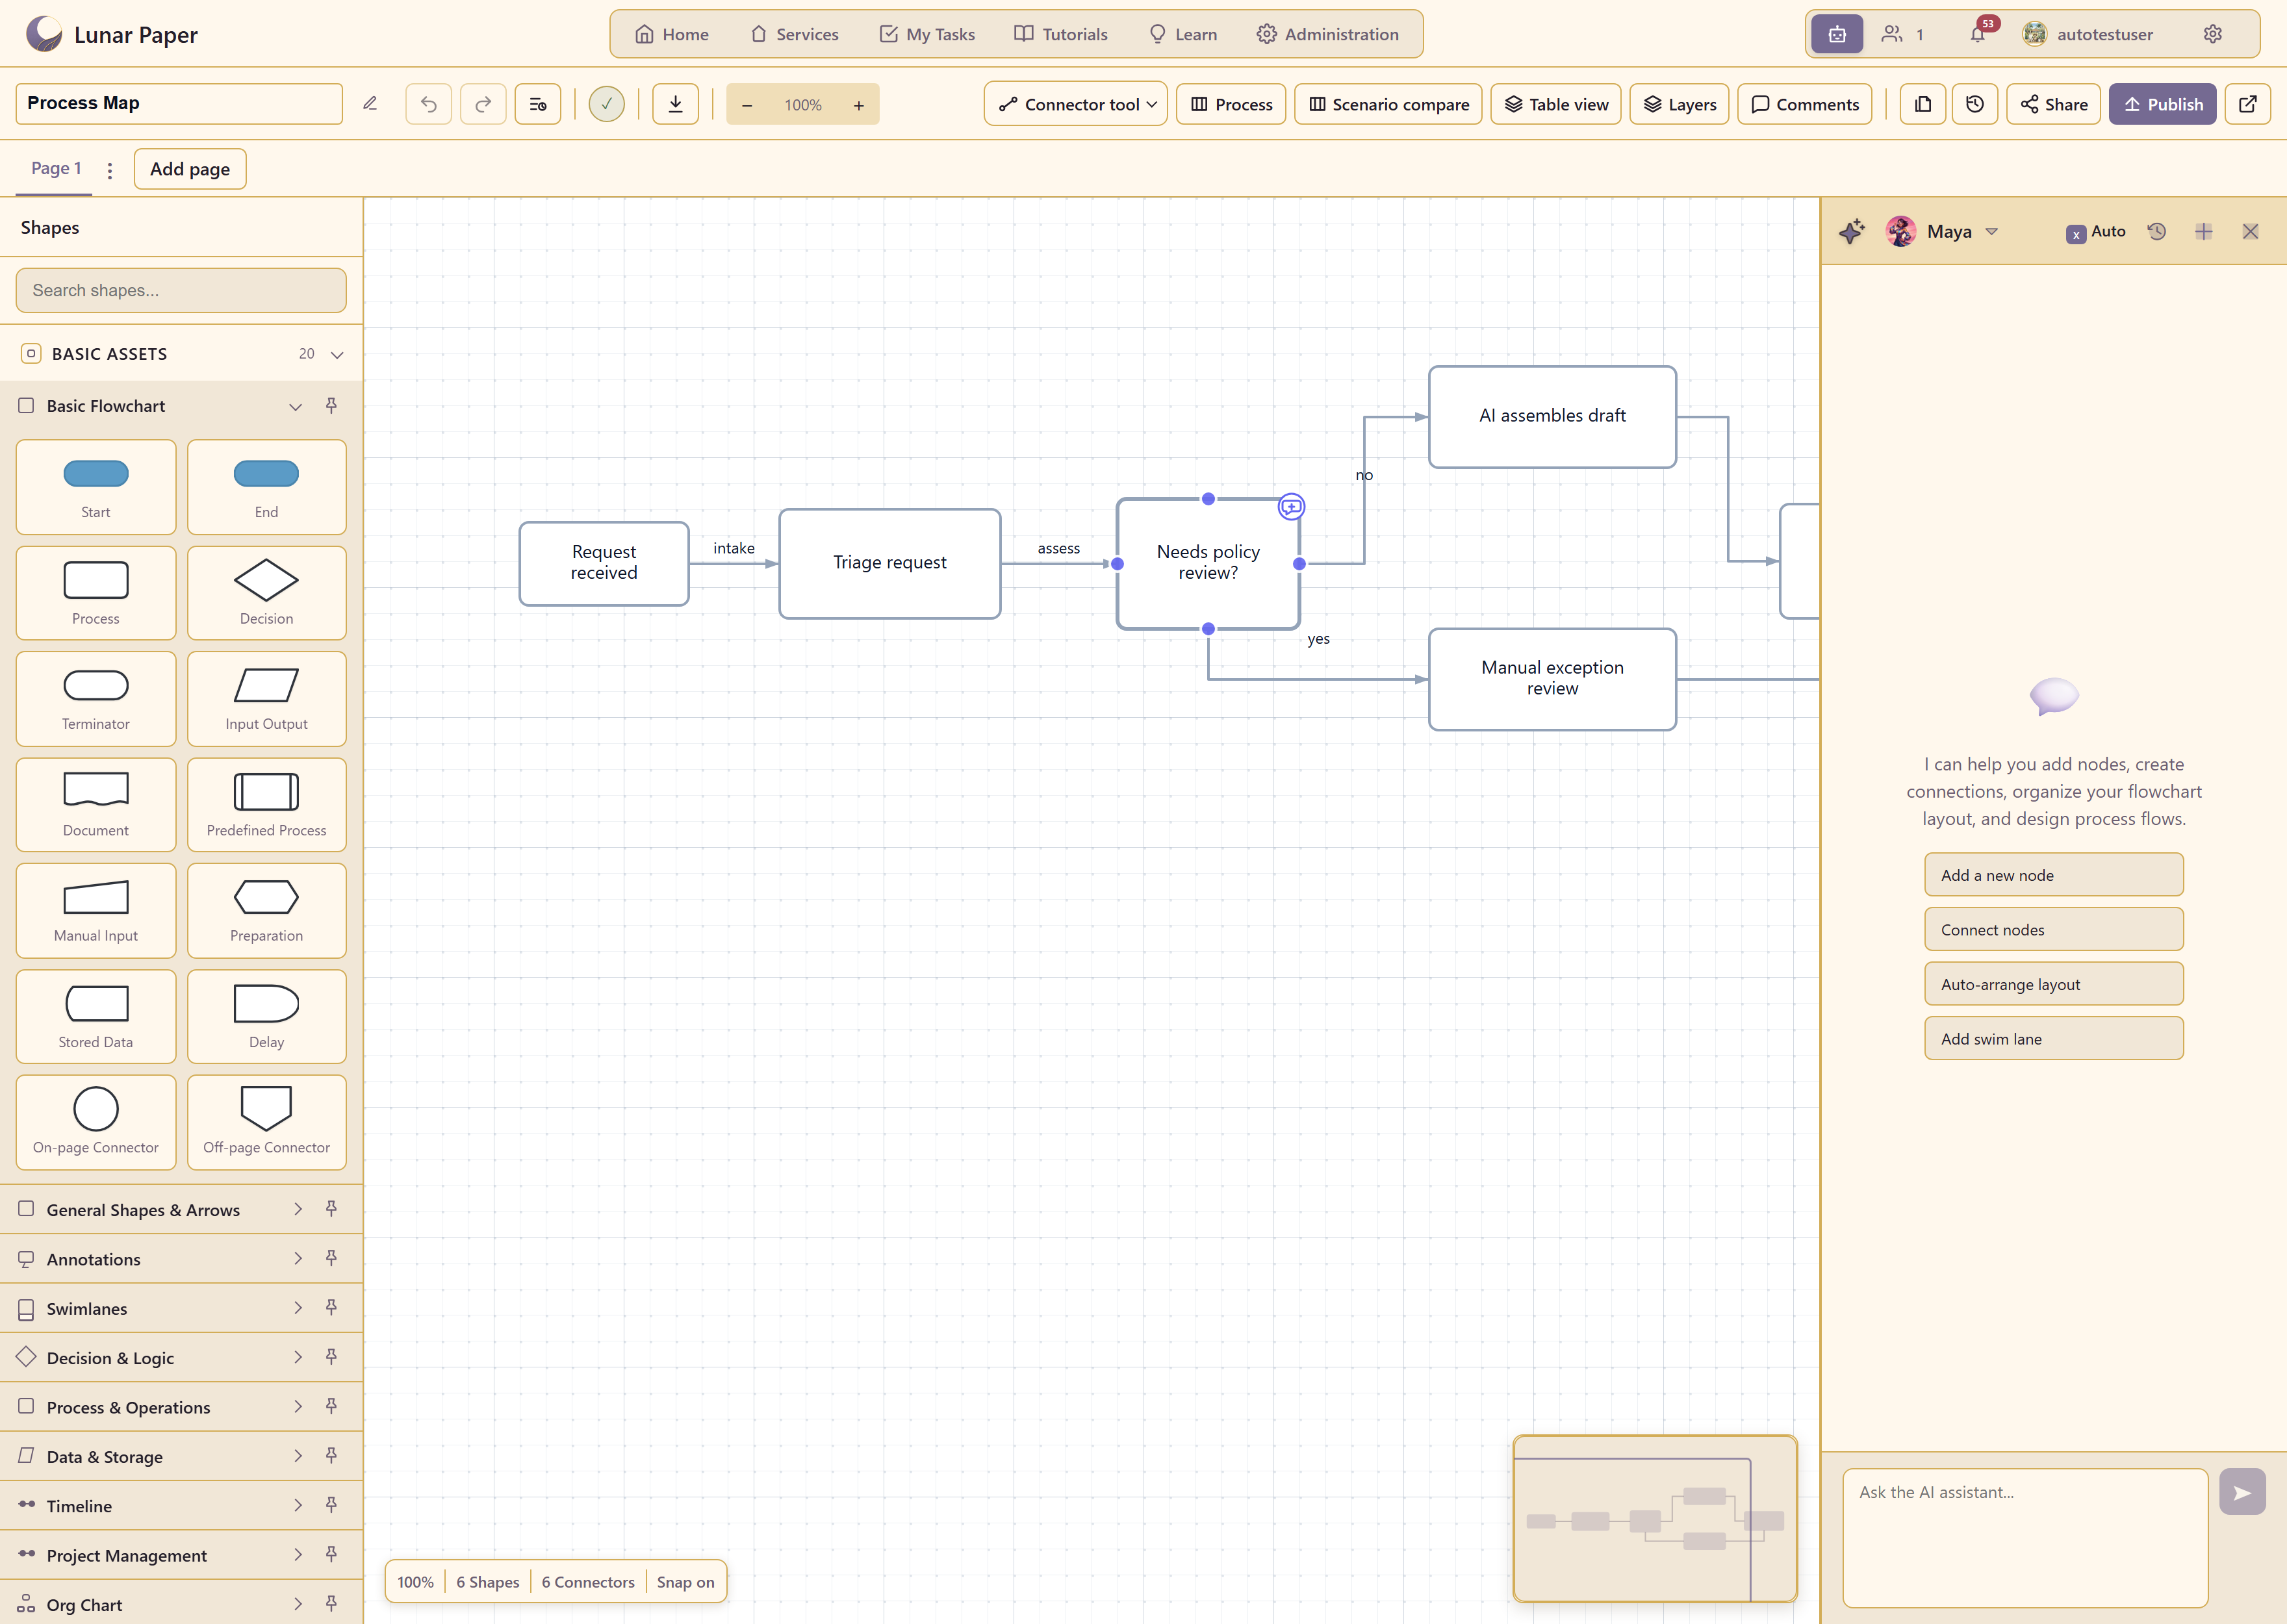
It introduces itself with what it can do here: add nodes, create connections, organise the layout, and design process flows. Four quick actions sit underneath — Add a new node, Connect nodes, Auto-arrange layout, and Add swim lane — and there is a text box for anything else.
The header has a persona selector, a model selector set to Auto, a history button, and a button to start a fresh conversation.
If the button is not there
Section titled “If the button is not there”The assistant is switched on per user for the Charts module. If a colleague has it and you do not, that is a setting rather than a fault, and an administrator can change it.
What it can actually change
Section titled “What it can actually change”It edits the chart directly. It can:
Add, update, move, resize, restyle, reorder, lock, group, ungroup, and delete shapes.
Add, update, and delete connectors.
Add swimlanes, reorder them, stack them, and detach shapes from them.
Align shapes, distribute them evenly, and run an automatic layout.
Set the chart’s details and its staffing roles.
So “add a rejection path from the review step to an end node, and lay it out” is a reasonable request, not a stretch.
Ask for structure, check the detail yourself
Section titled “Ask for structure, check the detail yourself”The assistant is good at the shape of a thing and indifferent to whether it is true. It will happily produce a plausible six-step approval process that is not your approval process.
The way that pays off is to use it for scaffolding and then correct the content:
Ask for the structure — “add five steps in a row between intake and close” — and rename them yourself.
Ask for the layout — “auto-arrange this” — and check nothing has crossed over something it should not.
Ask for a swimlane frame — “add lanes for Support, Engineering, and Finance” — and move the existing shapes into them yourself.
Be specific about where
Section titled “Be specific about where”The assistant works from what is on the canvas, so referring to shapes by their labels works well: “connect Triage request to Manual exception review” is unambiguous, “connect the second box to the one below” is not.
Naming your shapes properly, which is worth doing anyway, makes the assistant substantially more useful.
Check what it did before carrying on
Section titled “Check what it did before carrying on”Every change lands on the canvas, and Undo reverses it like any other edit.
Look at the result before the next instruction. Two or three stacked requests on a canvas you have not checked is how you end up with a chart that needs unpicking, and undo only takes you back one step at a time.
Where it does not help
Section titled “Where it does not help”It does not know your process. Durations, wait times, SLAs, risk levels, and who owns what are facts about your organisation, and the assistant has no access to them. Fill those in yourself in Table view.
It cannot tell you whether the process is right. It can draw what you describe; whether the description matches reality is still a question for the people who do the work.
Related
Section titled “Related”Draw a diagram from scratch covers doing the same things by hand, which is often quicker for small changes. Annotate steps in the table covers the process data the assistant cannot supply.