
Dashboards
Dashboards turns data a service already holds into a screen people can read. You place widgets on a canvas, drag columns onto them, and publish the result so the rest of the service can open it.
The data does not come from Dashboards. It comes from Data Hub, the module directly above it, which owns the connection to the database or file. Dashboards reads what Data Hub exposes and draws it. (Connecting to cloud data covers the cloud providers Data Hub supports.)
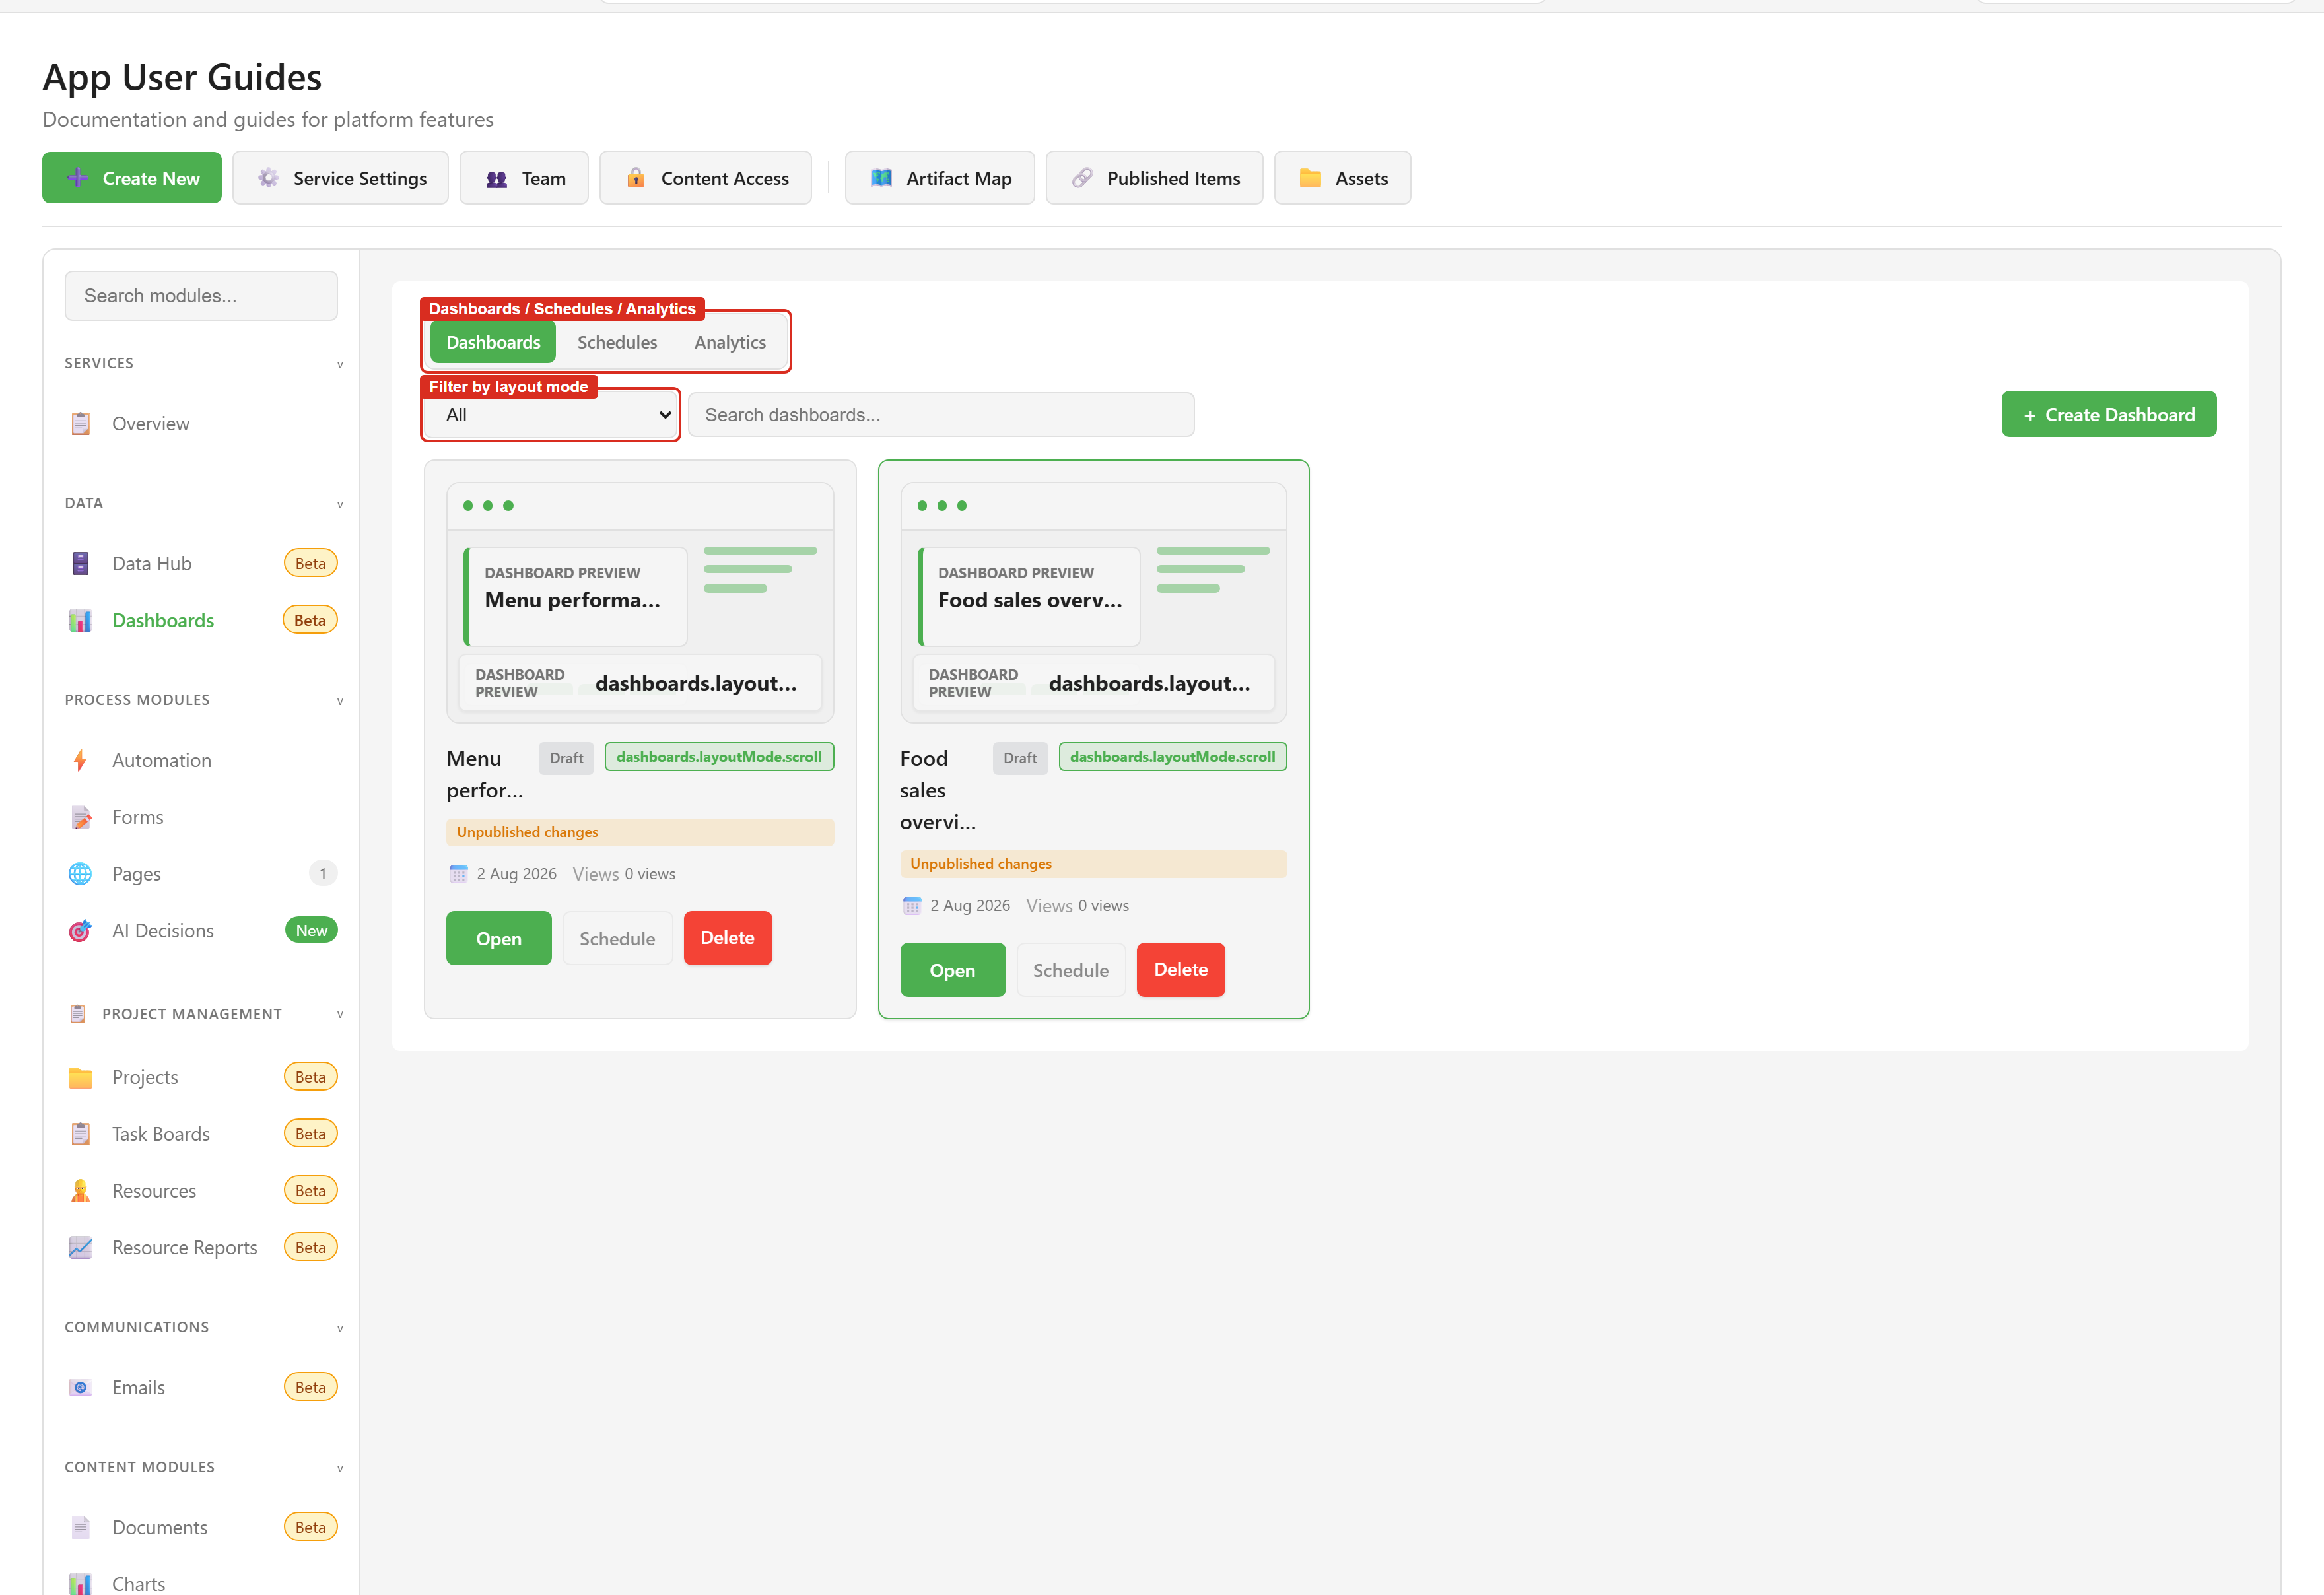
Where Dashboards lives
Section titled “Where Dashboards lives”Open a service and choose Dashboards under Data. Data Hub sits directly above it. Both carry a Beta badge.
The module opens on three tabs. Dashboards lists what exists. Schedules holds recurring deliveries. Analytics reports on how the published dashboards are being used.
The one decision you cannot undo
Section titled “The one decision you cannot undo”A dashboard is created in one of three layout modes — fit to screen, scroll, or paginated — and the mode cannot be changed afterwards. The designer shows it as a read-only badge next to the name. If you pick the wrong one, you have to rebuild on a new dashboard.
Read Layout modes before you create anything. It is short, and it covers the only choice in the module you cannot undo.
What a dashboard is made of
Section titled “What a dashboard is made of”A dashboard is a canvas holding widgets. Each widget has a position, a size, a type, and — if it shows data — a binding that says which columns feed which part of the chart.
You make a binding by dragging a column from the Data panel onto a widget. There is no dropdown that lets you pick a column from scratch, so dragging is the only way. How data reaches a widget follows the whole path from the database to the finished chart.
Two limits are worth knowing early. Nothing on a dashboard refreshes on its own — a published dashboard shows the data it fetched when the page loaded, and the reader has to reload to see anything newer. And a dashboard cannot be renamed once created, so the name you type in the creation dialog is permanent.
Dashboards and AI usage
Section titled “Dashboards and AI usage”The AI Assistant can help build and edit a dashboard using its layout, widgets, and pinned data sources.
You must pin the data sources in the Dashboards module before the AI can use them. Open the dashboard designer, choose Data, and use the star-shaped Pin control beside each dataset or data view you want the AI to use. Check that they appear under Pinned before opening AI Assistant.
Connecting a source in Data Hub or seeing it in the Data panel does not make it available to dashboard AI. Pins belong to the current dashboard, so check them again when working on another dashboard.
Dashboards and AI usage walks through pinning sources and asking for help.
Where to go
Section titled “Where to go”| If you want to | Go to |
|---|---|
| Get a dashboard working end to end | Quickstart |
| Follow a specific workflow | Guides — data, AI, layout, publishing, and delivery |
| Build or edit with AI | Dashboards and AI usage — pin sources before asking |
| Find which page covers a capability | Dashboards capabilities |
| Pick a layout mode | Layout modes |
| Understand where the numbers come from | How data reaches a widget |
| Look up a widget type | Widget catalogue |
| Look up a control in the designer | Designer toolbar reference |
| Check who is allowed to do what | Permissions reference |
| Fix something that is not behaving | Troubleshooting |
The examples in these screenshots
Section titled “The examples in these screenshots”Captures use a restaurant dataset held in a DuckDB file and connected through Data Hub as Food sales (DuckDB). Four data views sit on top of it — monthly popularity, menu items, restaurants, and dishes. The dashboard built from them, Food sales overview, is a scroll-mode page with eight widgets: a heading, three KPI cards, a line chart of orders by month, a bar chart of popularity by course, a pie chart of restaurants by price tier, and a table of menu items. A second dashboard, Menu performance, is in fit-to-screen mode, so the layout filter has more than one mode to choose between.