
Build a view
A view is a saved query — the shape you actually want, built once and reused by every chart and export that needs it. It is the difference between fixing a calculation in one place and fixing it in nine.
Open the wizard
Section titled “Open the wizard”Go to the Views tab and choose + Create View.
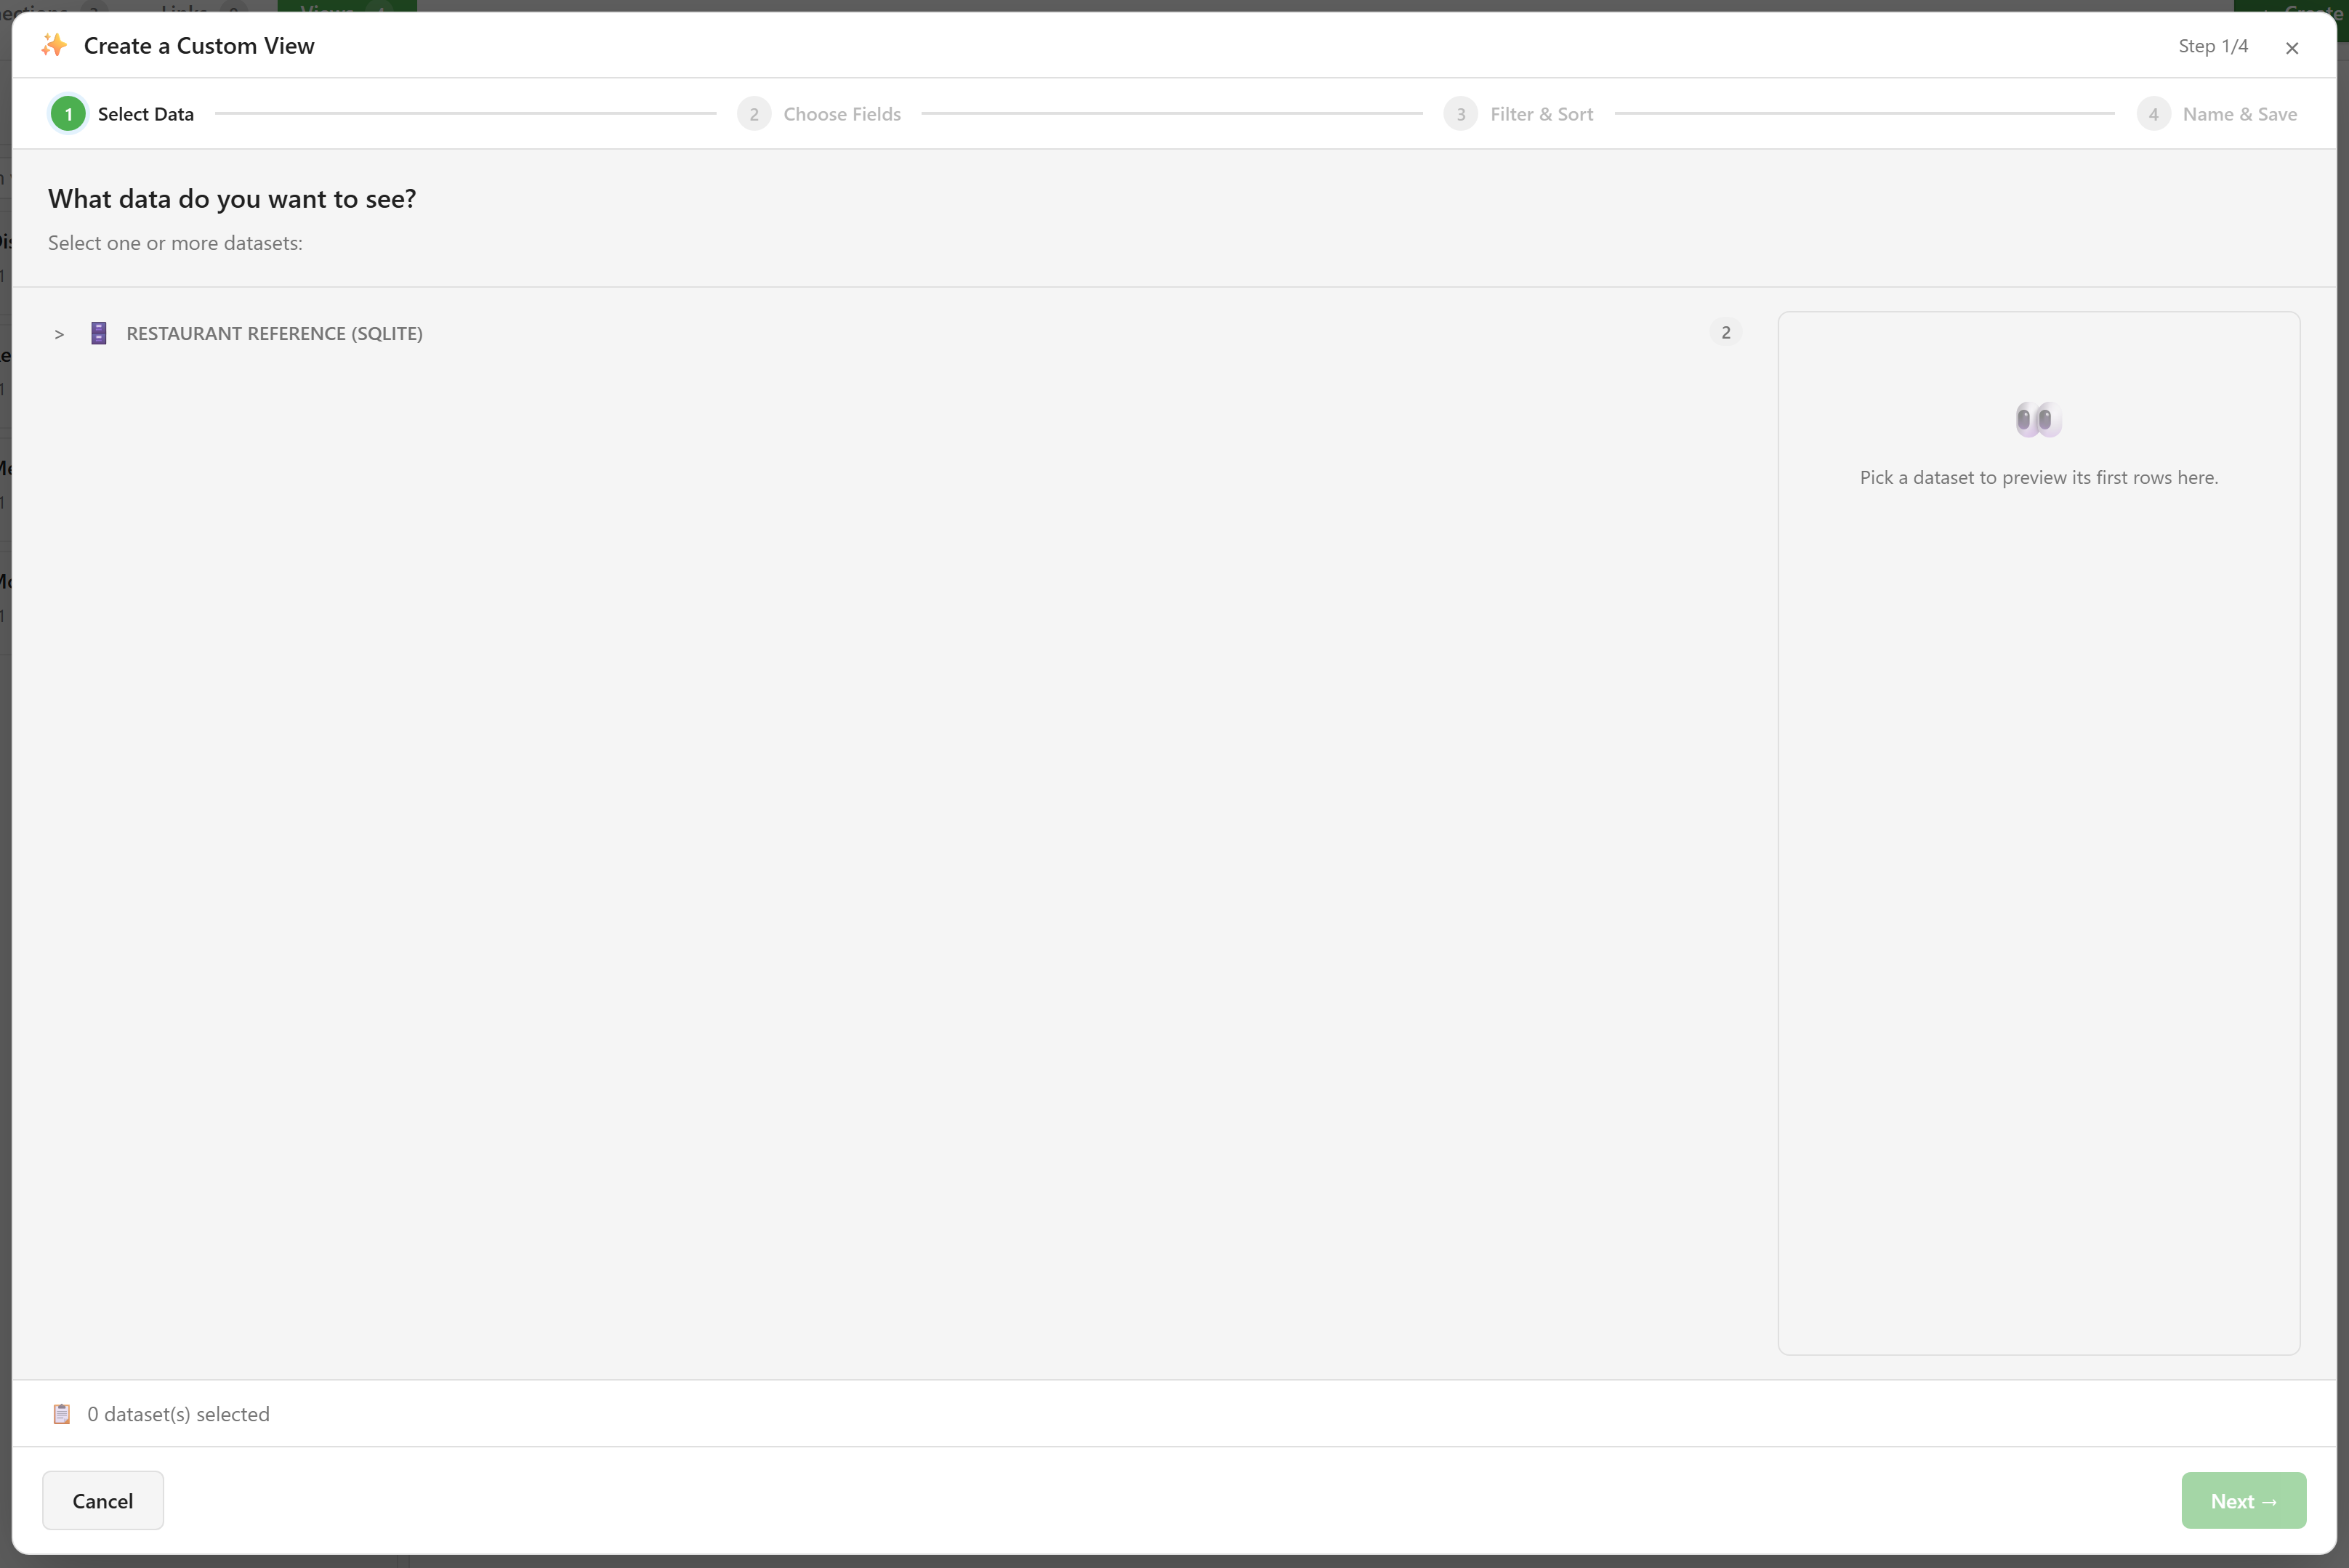
The wizard runs in four steps, shown across the top: Select Data, Choose Fields, Filter & Sort, and Name & Save.
1. Select data
Section titled “1. Select data”Datasets are grouped by the connection they came from. Expand a connection and pick one or more.
Only enabled tables appear here. If something is missing, it has not been exposed yet — Choose which tables to expose covers that.
Picking more than one is how you join. The preview pane on the right shows the first rows of whatever you select, which is a quick check that you picked the right thing.
2. Choose fields
Section titled “2. Choose fields”Keep the columns that matter and drop the rest.
Be ruthless. A view carrying forty columns because they were there is harder to use downstream than one carrying the six a chart actually needs, and every extra column is data being moved for no reason.
3. Filter and sort
Section titled “3. Filter and sort”Apply the conditions that should always be true of this view — active customers only, this financial year, excluding test records.
The test for whether a filter belongs here rather than in a chart: would every consumer of this view want it? “Exclude cancelled orders” usually yes. “Only January” usually no.
Sorting set here becomes the view’s default order.
4. Name and save
Section titled “4. Name and save”Name it for what it contains, not how it was built. “Active customers” tells the next person what they are getting; “customers_v2_filtered” does not.
Saving makes the view LIVE at version v1. It appears in the Views list and immediately becomes available to other modules in the service.
Editing later
Section titled “Editing later”Views are versioned. Editing a saved view and saving again produces a new version, and the History control in the Views panel shows what has gone before.
Changes take effect for everything using the view. That is the point — but it does mean removing a column that a dashboard depends on will break that dashboard, without warning at the moment you save.
Views versus datasets
Section titled “Views versus datasets”Both appear as bindable sources downstream, and both work. The difference is where the work lives.
Bind a chart to a raw dataset and the filtering and shaping happen in the chart. Bind it to a view and they happen once, here, for everyone.
Use a dataset when the table is already the right shape. Use a view as soon as two things need the same non-obvious shape.
Related
Section titled “Related”How data becomes available puts views in the context of the whole chain. Map relationships covers the joins the wizard can draw on.